Estimated Value: $737,000 - $813,000
3
Beds
2
Baths
1,550
Sq Ft
$506/Sq Ft
Est. Value
About This Home
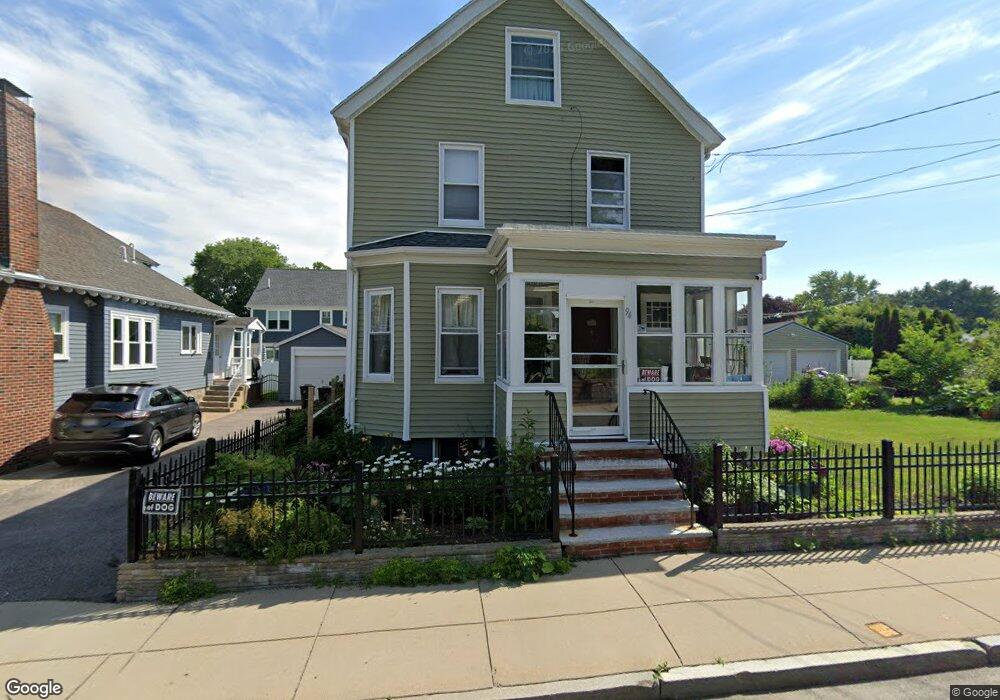
This home is located at 94 Desoto Rd, West Roxbury, MA 02132 and is currently estimated at $784,015, approximately $505 per square foot. 94 Desoto Rd is a home located in Suffolk County with nearby schools including The Roxbury Latin School and Catholic Memorial School.
Ownership History
Date
Name
Owned For
Owner Type
Purchase Details
Closed on
Jun 8, 2006
Sold by
Fitzsimons Matthew O and Fitzsimons Sara L
Bought by
Reca Awilda and Reca Wilfredo
Current Estimated Value
Home Financials for this Owner
Home Financials are based on the most recent Mortgage that was taken out on this home.
Original Mortgage
$386,500
Outstanding Balance
$225,426
Interest Rate
6.62%
Mortgage Type
Purchase Money Mortgage
Estimated Equity
$558,589
Purchase Details
Closed on
Nov 7, 2003
Sold by
Pepin Ruthanne G and Pepin Eric B
Bought by
Fitzsimons Sara L and Fitzsimons Matthew O
Home Financials for this Owner
Home Financials are based on the most recent Mortgage that was taken out on this home.
Original Mortgage
$282,400
Interest Rate
6.01%
Mortgage Type
Purchase Money Mortgage
Purchase Details
Closed on
Jul 31, 1995
Sold by
Wong Lani R and Morra Eliott
Bought by
Pepin Eric B and Pepin Ruthanne G
Create a Home Valuation Report for This Property
The Home Valuation Report is an in-depth analysis detailing your home's value as well as a comparison with similar homes in the area
Home Values in the Area
Average Home Value in this Area
Purchase History
| Date | Buyer | Sale Price | Title Company |
|---|---|---|---|
| Reca Awilda | $386,500 | -- | |
| Fitzsimons Sara L | $353,000 | -- | |
| Pepin Eric B | $142,500 | -- |
Source: Public Records
Mortgage History
| Date | Status | Borrower | Loan Amount |
|---|---|---|---|
| Open | Reca Awilda | $386,500 | |
| Previous Owner | Pepin Eric B | $282,400 | |
| Previous Owner | Pepin Eric B | $52,950 | |
| Previous Owner | Pepin Eric B | $162,000 |
Source: Public Records
Tax History Compared to Growth
Tax History
| Year | Tax Paid | Tax Assessment Tax Assessment Total Assessment is a certain percentage of the fair market value that is determined by local assessors to be the total taxable value of land and additions on the property. | Land | Improvement |
|---|---|---|---|---|
| 2025 | $8,263 | $713,600 | $251,500 | $462,100 |
| 2024 | $7,590 | $696,300 | $257,800 | $438,500 |
| 2023 | $7,124 | $663,300 | $245,600 | $417,700 |
| 2022 | $6,006 | $614,100 | $227,400 | $386,700 |
| 2021 | $6,006 | $562,900 | $214,500 | $348,400 |
| 2020 | $5,508 | $521,600 | $198,900 | $322,700 |
| 2019 | $4,964 | $471,000 | $153,000 | $318,000 |
| 2018 | $4,699 | $448,400 | $153,000 | $295,400 |
| 2017 | $4,653 | $439,400 | $153,000 | $286,400 |
| 2016 | $4,693 | $426,600 | $153,000 | $273,600 |
| 2015 | $4,775 | $394,300 | $136,500 | $257,800 |
| 2014 | $4,632 | $368,200 | $136,500 | $231,700 |
Source: Public Records
Map
Nearby Homes
- 11 Cheriton Rd Unit 102B
- 70 Birchwood St
- 5245 Washington St Unit 5
- 94 Rockland St
- 57 Rockland St
- 25R Rockland St Unit 6
- 150 Grove St
- 45 Weymouth Ave
- 69 Berlin St
- 115 Grove St Unit 11
- 111 Grove St Unit 6
- 18 Harding Terrace
- 4975 Washington St Unit 311
- 4959 Washington St
- 83 Mount Hope St
- 42 Raldne Rd Unit 1
- 55 Cottage Rd
- 10 Starling St
- 38 Joan Rd
- 235 Curve St