94 Hill Rd Pittsburg, NH 03592
Estimated Value: $346,666 - $404,000
3
Beds
1
Bath
1,654
Sq Ft
$225/Sq Ft
Est. Value
About This Home
This home is located at 94 Hill Rd, Pittsburg, NH 03592 and is currently estimated at $372,667, approximately $225 per square foot. 94 Hill Rd is a home located in Coos County with nearby schools including Pittsburg Elementary/Middle School and Pittsburg High School.
Ownership History
Date
Name
Owned For
Owner Type
Purchase Details
Closed on
Nov 4, 2022
Sold by
Eisele Martha L
Bought by
Eisele Martha L and Britt Patrick J
Current Estimated Value
Purchase Details
Closed on
Sep 27, 2005
Sold by
Mitchell Donald D and Mitchell Joanne E
Bought by
Eisele Martha L
Home Financials for this Owner
Home Financials are based on the most recent Mortgage that was taken out on this home.
Original Mortgage
$102,320
Interest Rate
5.92%
Create a Home Valuation Report for This Property
The Home Valuation Report is an in-depth analysis detailing your home's value as well as a comparison with similar homes in the area
Home Values in the Area
Average Home Value in this Area
Purchase History
| Date | Buyer | Sale Price | Title Company |
|---|---|---|---|
| Eisele Martha L | -- | None Available | |
| Eisele Martha L | $127,900 | -- |
Source: Public Records
Mortgage History
| Date | Status | Borrower | Loan Amount |
|---|---|---|---|
| Previous Owner | Eisele Martha L | $102,320 | |
| Previous Owner | Eisele Martha L | $30,000 |
Source: Public Records
Tax History Compared to Growth
Tax History
| Year | Tax Paid | Tax Assessment Tax Assessment Total Assessment is a certain percentage of the fair market value that is determined by local assessors to be the total taxable value of land and additions on the property. | Land | Improvement |
|---|---|---|---|---|
| 2024 | $2,543 | $264,900 | $129,200 | $135,700 |
| 2023 | $2,543 | $264,900 | $129,200 | $135,700 |
| 2022 | $2,024 | $127,300 | $35,600 | $91,700 |
| 2021 | $1,981 | $127,300 | $35,600 | $91,700 |
| 2020 | $2,005 | $127,300 | $35,600 | $91,700 |
| 2019 | $2,037 | $127,300 | $35,600 | $91,700 |
| 2018 | $1,932 | $127,300 | $35,600 | $91,700 |
| 2016 | $1,928 | $122,800 | $45,900 | $76,900 |
| 2015 | $2,002 | $122,800 | $45,900 | $76,900 |
| 2014 | $2,118 | $122,800 | $45,900 | $76,900 |
| 2013 | $2,051 | $122,800 | $45,900 | $76,900 |
Source: Public Records
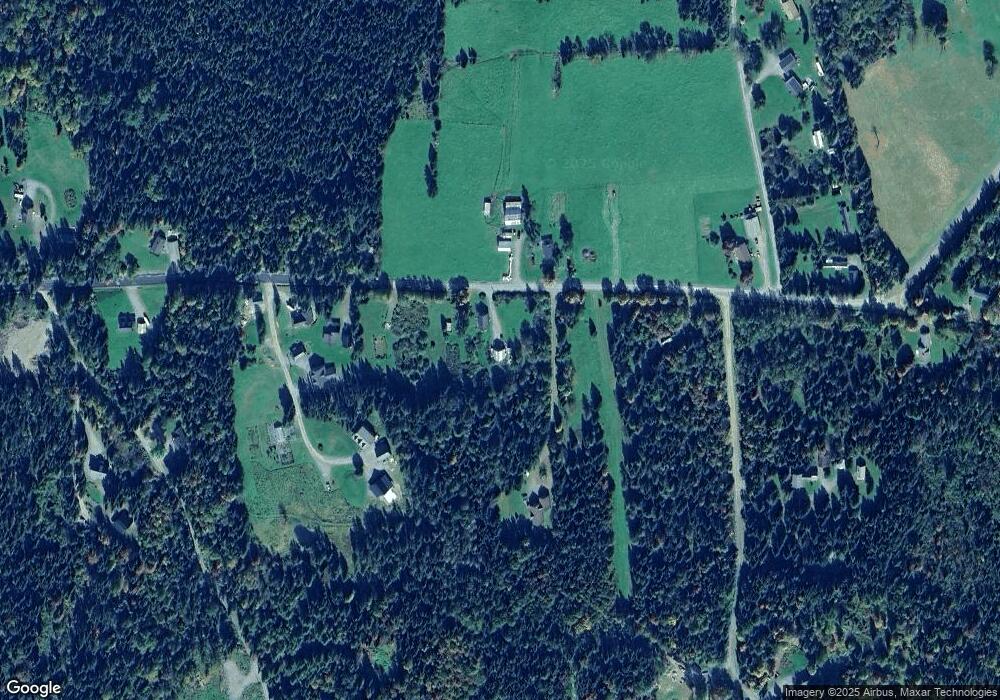
Map
Nearby Homes