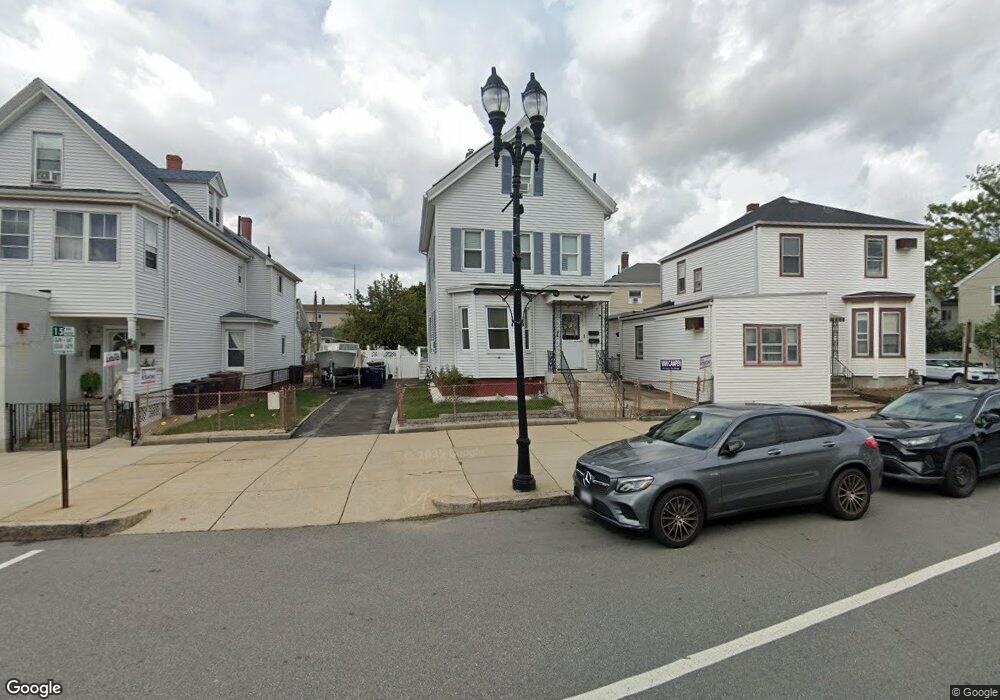
94 Main St Everett, MA 02149
West Everett NeighborhoodEstimated Value: $703,000 - $866,000
2
Beds
1
Bath
1,000
Sq Ft
$784/Sq Ft
Est. Value
About This Home
This home is located at 94 Main St, Everett, MA 02149 and is currently estimated at $783,822, approximately $783 per square foot. 94 Main St is a home located in Middlesex County with nearby schools including Everett High School, Pioneer Charter School of Science, and St Anthony School.
Ownership History
Date
Name
Owned For
Owner Type
Purchase Details
Closed on
Dec 13, 2018
Sold by
Macgregor Bruce and Macgregor Deborah
Bought by
Macgregor Deborah
Current Estimated Value
Home Financials for this Owner
Home Financials are based on the most recent Mortgage that was taken out on this home.
Original Mortgage
$226,200
Outstanding Balance
$199,484
Interest Rate
4.9%
Mortgage Type
New Conventional
Estimated Equity
$584,338
Purchase Details
Closed on
Oct 20, 1998
Sold by
Ricciardi Rose and Wholley Teresa
Bought by
Macgregor Bruce and Macgregor Deborah
Home Financials for this Owner
Home Financials are based on the most recent Mortgage that was taken out on this home.
Original Mortgage
$125,920
Interest Rate
6.8%
Mortgage Type
Purchase Money Mortgage
Create a Home Valuation Report for This Property
The Home Valuation Report is an in-depth analysis detailing your home's value as well as a comparison with similar homes in the area
Home Values in the Area
Average Home Value in this Area
Purchase History
| Date | Buyer | Sale Price | Title Company |
|---|---|---|---|
| Macgregor Deborah | -- | -- | |
| Macgregor Bruce | $167,900 | -- |
Source: Public Records
Mortgage History
| Date | Status | Borrower | Loan Amount |
|---|---|---|---|
| Open | Macgregor Deborah | $226,200 | |
| Previous Owner | Macgregor Bruce | $125,920 | |
| Closed | Macgregor Bruce | $33,580 |
Source: Public Records
Tax History
| Year | Tax Paid | Tax Assessment Tax Assessment Total Assessment is a certain percentage of the fair market value that is determined by local assessors to be the total taxable value of land and additions on the property. | Land | Improvement |
|---|---|---|---|---|
| 2025 | $8,225 | $722,100 | $220,400 | $501,700 |
| 2024 | $7,659 | $668,300 | $205,400 | $462,900 |
| 2023 | $7,464 | $633,600 | $195,400 | $438,200 |
| 2022 | $6,242 | $602,500 | $195,400 | $407,100 |
| 2021 | $5,728 | $580,300 | $188,400 | $391,900 |
| 2020 | $6,033 | $567,000 | $188,400 | $378,600 |
| 2019 | $6,373 | $514,800 | $179,400 | $335,400 |
| 2018 | $6,253 | $453,800 | $156,300 | $297,500 |
| 2017 | $5,788 | $400,800 | $130,300 | $270,500 |
| 2016 | $5,244 | $362,900 | $120,200 | $242,700 |
| 2015 | $4,929 | $337,400 | $113,000 | $224,400 |
Source: Public Records
Map
Nearby Homes
- 9 Carter St
- 39 Montrose St Unit 2
- 39 Parlin St Unit 203
- 19 Heath St
- 24 Corey St Unit 101
- 24 Corey St Unit 201
- 43 Charlton St Unit B108
- 34 Paris St
- 44-46 Cabot St
- 30 Chelsea St Unit 210
- 48 Cleveland Ave
- 340 Main St
- 37 Argyle St
- 139 Bucknam St
- 11 Hampshire St
- 121 Cottage St
- 181 Chelsea St
- 15 Staples Ave Unit 45
- 15 Staples Ave Unit 31
- 21 Staples Ave Unit 26
Your Personal Tour Guide
Ask me questions while you tour the home.