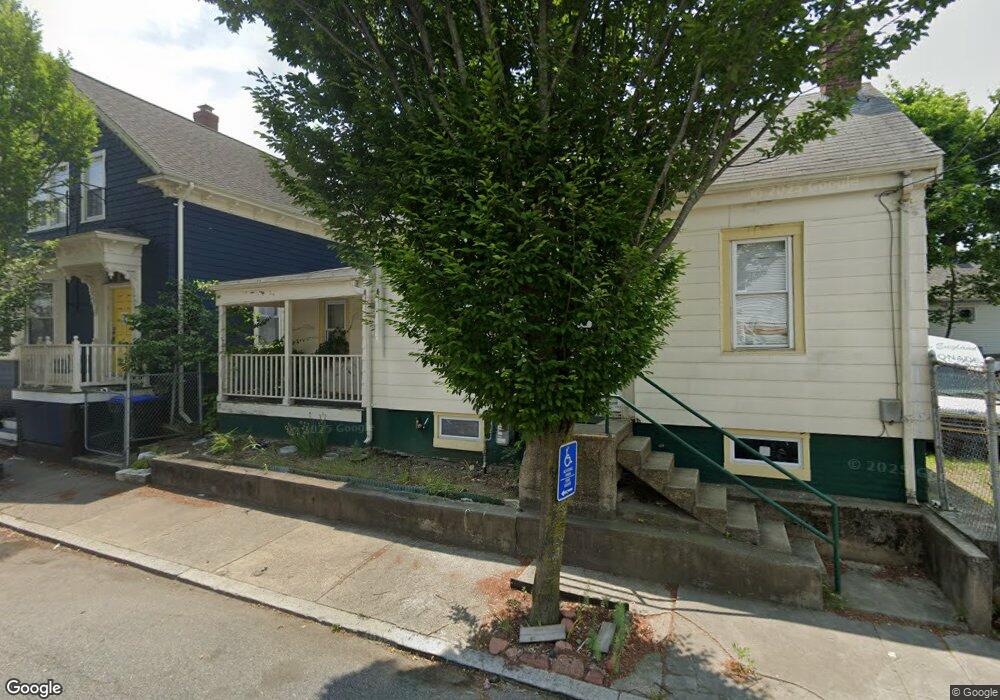
94 Pekin St Providence, RI 02908
Smith Hill NeighborhoodEstimated Value: $340,477 - $441,000
3
Beds
1
Bath
1,170
Sq Ft
$336/Sq Ft
Est. Value
About This Home
This home is located at 94 Pekin St, Providence, RI 02908 and is currently estimated at $393,369, approximately $336 per square foot. 94 Pekin St is a home located in Providence County with nearby schools including Asa Messer Elementary School, Charles N. Fortes Elementary School, and Veazie Street Elementary School.
Ownership History
Date
Name
Owned For
Owner Type
Purchase Details
Closed on
Jun 9, 2017
Sold by
Strong Tree Properties
Bought by
Lombardi Robert
Current Estimated Value
Purchase Details
Closed on
Mar 6, 2017
Sold by
Jak Properties Llc
Bought by
Strong Tree Properties
Purchase Details
Closed on
Dec 5, 2014
Sold by
Reservoir Ave Assoc
Bought by
Lombardi Anthony
Purchase Details
Closed on
Jun 28, 2011
Sold by
Vita Ventures
Bought by
Lombardi Anthony J
Create a Home Valuation Report for This Property
The Home Valuation Report is an in-depth analysis detailing your home's value as well as a comparison with similar homes in the area
Home Values in the Area
Average Home Value in this Area
Purchase History
| Date | Buyer | Sale Price | Title Company |
|---|---|---|---|
| Lombardi Robert | $37,000 | -- | |
| Strong Tree Properties | -- | -- | |
| Lombardi Anthony | $6,899 | -- | |
| Lombardi Anthony J | -- | -- |
Source: Public Records
Mortgage History
| Date | Status | Borrower | Loan Amount |
|---|---|---|---|
| Previous Owner | Lombardi Anthony J | $255,000 |
Source: Public Records
Tax History Compared to Growth
Tax History
| Year | Tax Paid | Tax Assessment Tax Assessment Total Assessment is a certain percentage of the fair market value that is determined by local assessors to be the total taxable value of land and additions on the property. | Land | Improvement |
|---|---|---|---|---|
| 2025 | $4,253 | $291,300 | $144,000 | $147,300 |
| 2024 | $3,481 | $189,700 | $68,000 | $121,700 |
| 2023 | $3,481 | $189,700 | $68,000 | $121,700 |
| 2022 | $3,377 | $189,700 | $68,000 | $121,700 |
| 2021 | $2,959 | $120,500 | $33,600 | $86,900 |
| 2020 | $2,959 | $120,500 | $33,600 | $86,900 |
| 2019 | $2,959 | $120,500 | $33,600 | $86,900 |
| 2018 | $3,337 | $104,400 | $36,000 | $68,400 |
| 2017 | $3,337 | $104,400 | $36,000 | $68,400 |
| 2016 | $3,337 | $104,400 | $36,000 | $68,400 |
| 2015 | $3,502 | $105,800 | $47,100 | $58,700 |
| 2014 | $3,571 | $105,800 | $47,100 | $58,700 |
| 2013 | $3,571 | $105,800 | $47,100 | $58,700 |
Source: Public Records
Map
Nearby Homes