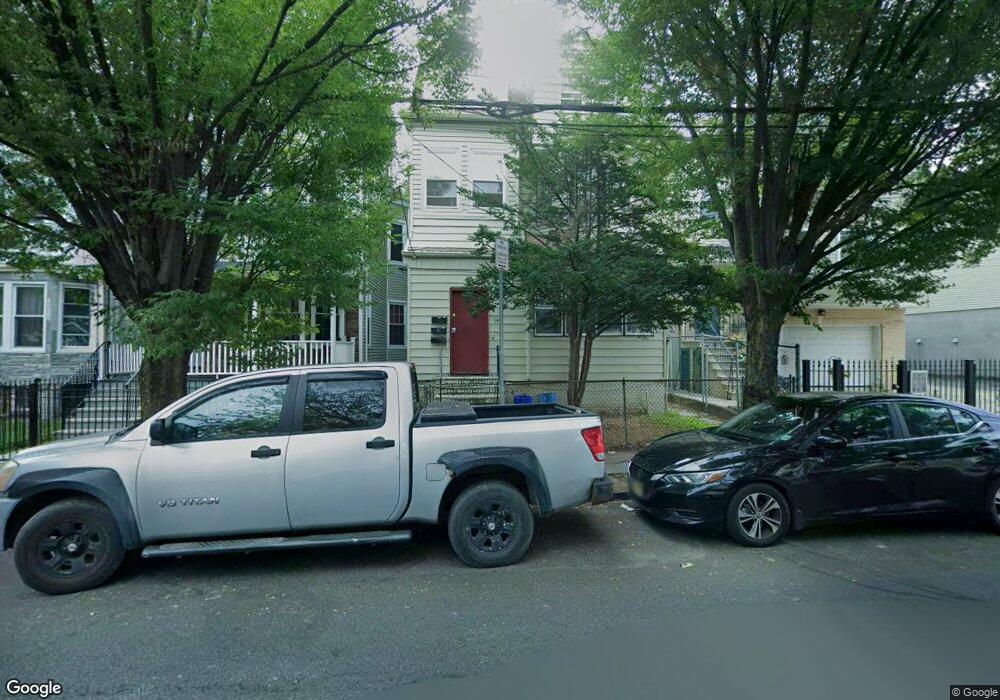
94 S 10th St Unit 3 Newark, NJ 07107
Fairmount NeighborhoodEstimated Value: $450,862 - $590,000
1
Bed
1
Bath
100
Sq Ft
$5,082/Sq Ft
Est. Value
About This Home
This home is located at 94 S 10th St Unit 3, Newark, NJ 07107 and is currently estimated at $508,216, approximately $5,082 per square foot. 94 S 10th St Unit 3 is a home located in Essex County with nearby schools including Sir Isaac Newton Elementary School, Harriet Tubman School, and Camden Street Elementary School.
Ownership History
Date
Name
Owned For
Owner Type
Purchase Details
Closed on
Apr 9, 1991
Sold by
Oxford Finance Cos Inc
Bought by
Domond Charles and Domond Gonsalves,Esmay
Current Estimated Value
Purchase Details
Closed on
Nov 29, 1990
Sold by
Dalessio Thomas J
Bought by
Oxford Fiance Cos Inc
Create a Home Valuation Report for This Property
The Home Valuation Report is an in-depth analysis detailing your home's value as well as a comparison with similar homes in the area
Home Values in the Area
Average Home Value in this Area
Purchase History
| Date | Buyer | Sale Price | Title Company |
|---|---|---|---|
| Domond Charles | $37,500 | -- | |
| Oxford Fiance Cos Inc | $100 | -- |
Source: Public Records
Tax History Compared to Growth
Tax History
| Year | Tax Paid | Tax Assessment Tax Assessment Total Assessment is a certain percentage of the fair market value that is determined by local assessors to be the total taxable value of land and additions on the property. | Land | Improvement |
|---|---|---|---|---|
| 2025 | $5,145 | $138,000 | $21,300 | $116,700 |
| 2024 | $5,145 | $138,000 | $21,300 | $116,700 |
| 2022 | $5,156 | $138,000 | $21,300 | $116,700 |
| 2021 | $5,153 | $138,000 | $21,300 | $116,700 |
| 2020 | $5,244 | $138,000 | $21,300 | $116,700 |
| 2019 | $5,190 | $138,000 | $21,300 | $116,700 |
| 2018 | $5,096 | $138,000 | $21,300 | $116,700 |
| 2017 | $4,913 | $138,000 | $21,300 | $116,700 |
| 2016 | $4,747 | $138,000 | $21,300 | $116,700 |
| 2015 | $4,566 | $138,000 | $21,300 | $116,700 |
| 2014 | $4,279 | $138,000 | $21,300 | $116,700 |
Source: Public Records
Map
Nearby Homes
- 94 S 10th St Unit 2
- 94 S 10th St
- 94 S 10th St
- 92 S 10th St
- 96-98 S 10th St
- 90 S 10th St
- 90 S 10th St Unit 1
- 100 S 10th St
- 86 S 10th St Unit 88
- 102 S 10th St
- 102 S 10th St Unit 1
- 63 S 9th St
- 67 S 9th St Unit 3
- 67 S 9th St
- 67 S 9th St
- 67 S 9th St Unit 2
- 65 S 9th St
- 65 S 9th St Unit 1
- 69 S 9th St
- 57 S 9th St