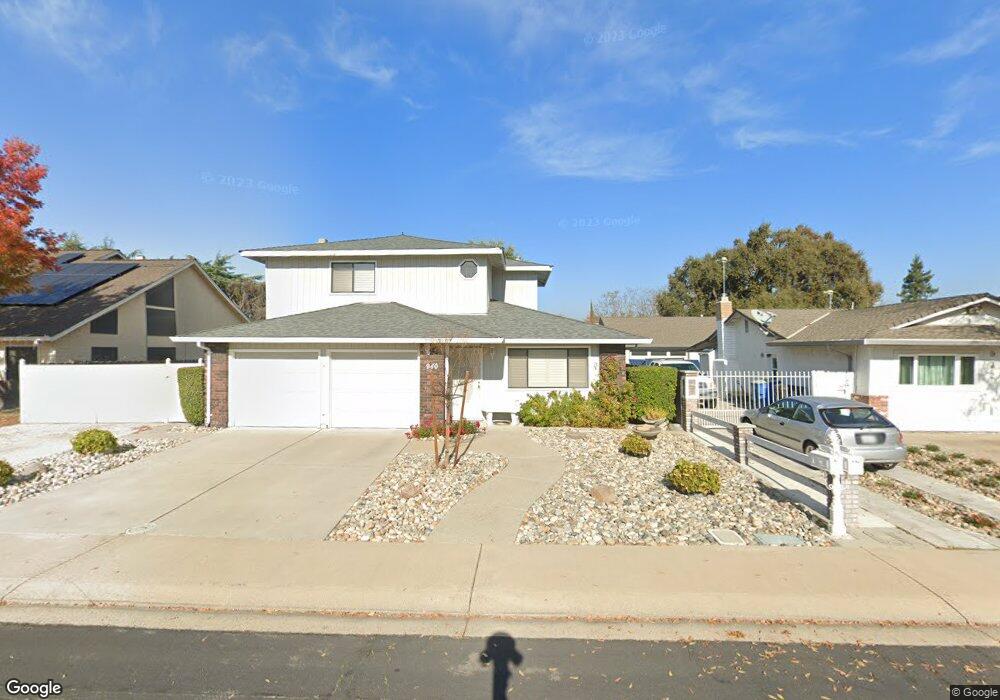
940 Alpine Ave Manteca, CA 95336
Downtown Manteca NeighborhoodEstimated Value: $503,000 - $578,000
4
Beds
2
Baths
1,876
Sq Ft
$285/Sq Ft
Est. Value
About This Home
This home is located at 940 Alpine Ave, Manteca, CA 95336 and is currently estimated at $535,370, approximately $285 per square foot. 940 Alpine Ave is a home located in San Joaquin County with nearby schools including Shasta Elementary School, Manteca High School, and St. Anthony's Catholic School.
Ownership History
Date
Name
Owned For
Owner Type
Purchase Details
Closed on
Dec 15, 2000
Sold by
Pacheco Philip H and Pacheco Violet J
Bought by
Pacheco Philip H and Pacheco Violet J
Current Estimated Value
Home Financials for this Owner
Home Financials are based on the most recent Mortgage that was taken out on this home.
Original Mortgage
$60,000
Interest Rate
7.81%
Purchase Details
Closed on
Jan 12, 2000
Sold by
Shurtleff Chester and Shurtleff Family Revocable Tru
Bought by
Pacheco Philip H and Pacheco Violet J
Purchase Details
Closed on
Dec 13, 1996
Sold by
Shurtleff Chester A and Shurtleff Carolyn J
Bought by
Shurtleff Chester A and Shurtleff Carolyn J
Purchase Details
Closed on
Nov 15, 1994
Sold by
Va
Bought by
Shurtleff Chester A and Shurtleff Carolyn J
Home Financials for this Owner
Home Financials are based on the most recent Mortgage that was taken out on this home.
Original Mortgage
$100,000
Interest Rate
8.9%
Create a Home Valuation Report for This Property
The Home Valuation Report is an in-depth analysis detailing your home's value as well as a comparison with similar homes in the area
Home Values in the Area
Average Home Value in this Area
Purchase History
| Date | Buyer | Sale Price | Title Company |
|---|---|---|---|
| Pacheco Philip H | -- | Chicago Title Co | |
| Pacheco Philip H | -- | Chicago Title Co | |
| Pacheco Philip H | $195,000 | Chicago Title Co | |
| Shurtleff Chester A | -- | Chicago Title Co | |
| Shurtleff Chester A | -- | Chicago Title Co | |
| Shurtleff Chester A | -- | Chicago Title Company |
Source: Public Records
Mortgage History
| Date | Status | Borrower | Loan Amount |
|---|---|---|---|
| Closed | Pacheco Philip H | $60,000 | |
| Previous Owner | Shurtleff Chester A | $100,000 |
Source: Public Records
Tax History
| Year | Tax Paid | Tax Assessment Tax Assessment Total Assessment is a certain percentage of the fair market value that is determined by local assessors to be the total taxable value of land and additions on the property. | Land | Improvement |
|---|---|---|---|---|
| 2025 | $3,267 | $299,692 | $69,157 | $230,535 |
| 2024 | $3,174 | $293,816 | $67,801 | $226,015 |
| 2023 | $3,134 | $288,056 | $66,472 | $221,584 |
| 2022 | $3,085 | $282,409 | $65,169 | $217,240 |
| 2021 | $3,050 | $276,873 | $63,892 | $212,981 |
| 2020 | $2,926 | $274,035 | $63,237 | $210,798 |
| 2019 | $2,887 | $268,663 | $61,998 | $206,665 |
| 2018 | $2,847 | $263,396 | $60,783 | $202,613 |
| 2017 | $2,804 | $258,233 | $59,592 | $198,641 |
| 2016 | $2,735 | $253,171 | $58,424 | $194,747 |
| 2014 | $2,540 | $244,483 | $56,419 | $188,064 |
Source: Public Records
Map
Nearby Homes
- 736 E Louise Ave
- 1267 Laurel Dr
- 1231 Marceline Dr
- 1245 Marceline Dr
- 1283 Marceline Dr
- 1152 Laureto St
- 1322 Marceline Dr
- 396 Lancaster Dr
- 1342 Marceline Dr
- 544 Hawes St
- 1042 Briar Ct
- 930 Palomino St
- 1049 Briar Ct
- 1371 Crescent Ave
- 1368 Crescent Ave
- 1253 E Louise Ave
- 619 Heathridge St
- 854 Conrad St
- 756 Conrad St
- 889 Conrad St
- 932 Alpine Ave
- 948 Alpine Ave
- 792 E Louise Ave
- 924 Alpine Ave
- 956 Alpine Ave
- 943 Alpine Ave
- 937 Alpine Ave
- 951 Alpine Ave
- 916 Alpine Ave
- 968 Alpine Ave
- 758 E Louise Ave
- 925 Alpine Ave
- 963 Alpine Ave
- 880 E Louise Ave
- 917 Alpine Ave
- 974 Alpine Ave
- 908 Alpine Ave
- 760 E Louise Ave
- 969 Alpine Ave
- 942 Placer Ave
Your Personal Tour Guide
Ask me questions while you tour the home.