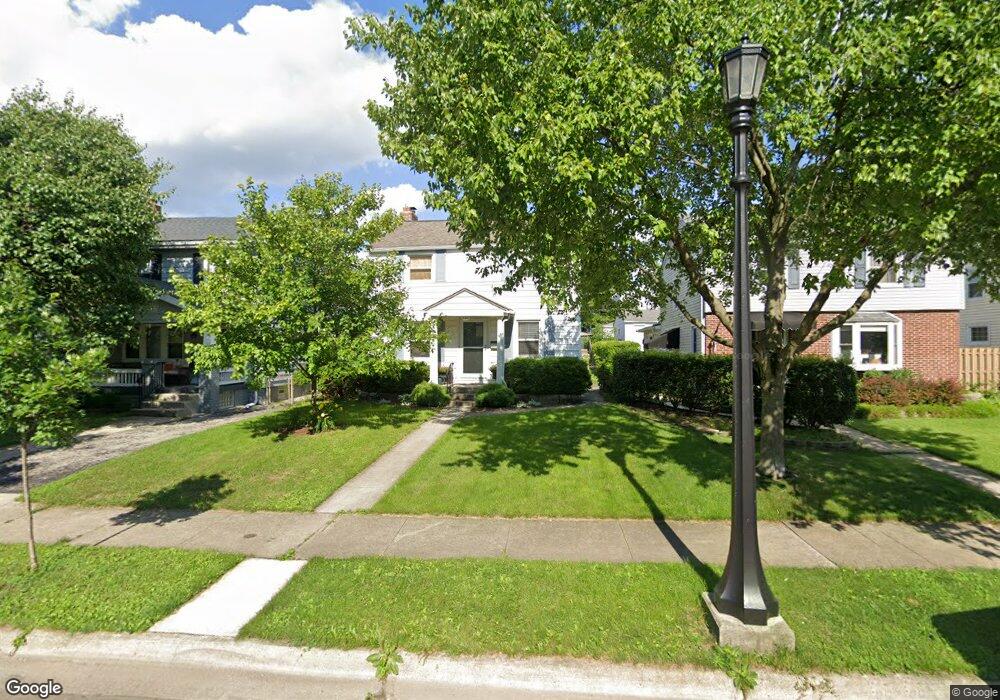
940 Mcclain Rd Columbus, OH 43212
Estimated Value: $419,000 - $461,000
3
Beds
1
Bath
1,152
Sq Ft
$382/Sq Ft
Est. Value
About This Home
This home is located at 940 Mcclain Rd, Columbus, OH 43212 and is currently estimated at $439,740, approximately $381 per square foot. 940 Mcclain Rd is a home located in Franklin County with nearby schools including Robert Louis Stevenson Elementary School, Larson Middle School, and Grandview Heights High School.
Ownership History
Date
Name
Owned For
Owner Type
Purchase Details
Closed on
Sep 8, 2009
Sold by
Johnson Eric A and Aurora Loan Services Llc
Bought by
Diyanni Mary M
Current Estimated Value
Purchase Details
Closed on
Nov 13, 2000
Sold by
Berger Irene Revocable Trust and Irene
Bought by
Johnson Eric A
Home Financials for this Owner
Home Financials are based on the most recent Mortgage that was taken out on this home.
Original Mortgage
$114,750
Interest Rate
7.86%
Mortgage Type
Purchase Money Mortgage
Purchase Details
Closed on
Nov 3, 1992
Bought by
Berger Irene Revocable
Create a Home Valuation Report for This Property
The Home Valuation Report is an in-depth analysis detailing your home's value as well as a comparison with similar homes in the area
Home Values in the Area
Average Home Value in this Area
Purchase History
| Date | Buyer | Sale Price | Title Company |
|---|---|---|---|
| Diyanni Mary M | $121,000 | Attorney | |
| Johnson Eric A | $135,000 | Chicago Title | |
| Berger Irene Revocable | -- | -- |
Source: Public Records
Mortgage History
| Date | Status | Borrower | Loan Amount |
|---|---|---|---|
| Previous Owner | Johnson Eric A | $114,750 |
Source: Public Records
Tax History
| Year | Tax Paid | Tax Assessment Tax Assessment Total Assessment is a certain percentage of the fair market value that is determined by local assessors to be the total taxable value of land and additions on the property. | Land | Improvement |
|---|---|---|---|---|
| 2025 | $10,031 | $119,600 | $57,650 | $61,950 |
| 2024 | $10,031 | $119,600 | $57,650 | $61,950 |
| 2023 | $6,111 | $119,595 | $57,645 | $61,950 |
| 2022 | $6,206 | $103,430 | $36,650 | $66,780 |
| 2021 | $5,810 | $103,430 | $36,650 | $66,780 |
| 2020 | $5,786 | $103,430 | $36,650 | $66,780 |
| 2019 | $5,648 | $89,360 | $36,650 | $52,710 |
| 2018 | $4,840 | $89,360 | $36,650 | $52,710 |
| 2017 | $5,266 | $89,360 | $36,650 | $52,710 |
| 2016 | $4,055 | $58,910 | $24,330 | $34,580 |
| 2015 | $4,056 | $58,910 | $24,330 | $34,580 |
| 2014 | $4,068 | $58,910 | $24,330 | $34,580 |
| 2013 | $1,787 | $53,550 | $22,120 | $31,430 |
Source: Public Records
Map
Nearby Homes
- 945 Quay Ave Unit 945E
- 1081 W 3rd Ave
- 1126 Northwest Blvd
- 922 Northwest Blvd
- 912 Northwest Blvd Unit 910
- 951 Hudson Crossing
- 967-973 Burr Ave
- 942 W 1st Ave
- 827 Northwest Blvd Unit 827-833
- 952 Pullman Place Unit 27
- 950 Pullman Place Unit 27
- 1416 Inglis Ave
- 789 Northwest Blvd Unit G
- 1116 Edgehill Rd
- 862 Pullman Way
- 1242 Oxley Rd
- 1083 W 3rd Ave
- 1095 W 3rd Ave
- 1093 W 3rd Ave
- 1475 W 3rd Ave Unit 204
- 942 Mcclain Rd
- 932 Mcclain Rd
- 948 Mcclain Rd
- 926 Mcclain Rd
- 952 Mcclain Rd
- 922 Mcclain Rd
- 939 Oxley Rd Unit 941
- 925 Oxley Rd Unit 927
- 918 Mcclain Rd
- 941 Oxley Rd
- 931 Oxley Rd
- 919 Oxley Rd Unit 921
- 945 Oxley Rd Unit 947
- 941 Mcclain Rd
- 933 Mcclain Rd
- 945 Mcclain Rd
- 921 Oxley Rd
- 964 Mcclain Rd
- 929 Mcclain Rd
- 912 Mcclain Rd
Your Personal Tour Guide
Ask me questions while you tour the home.