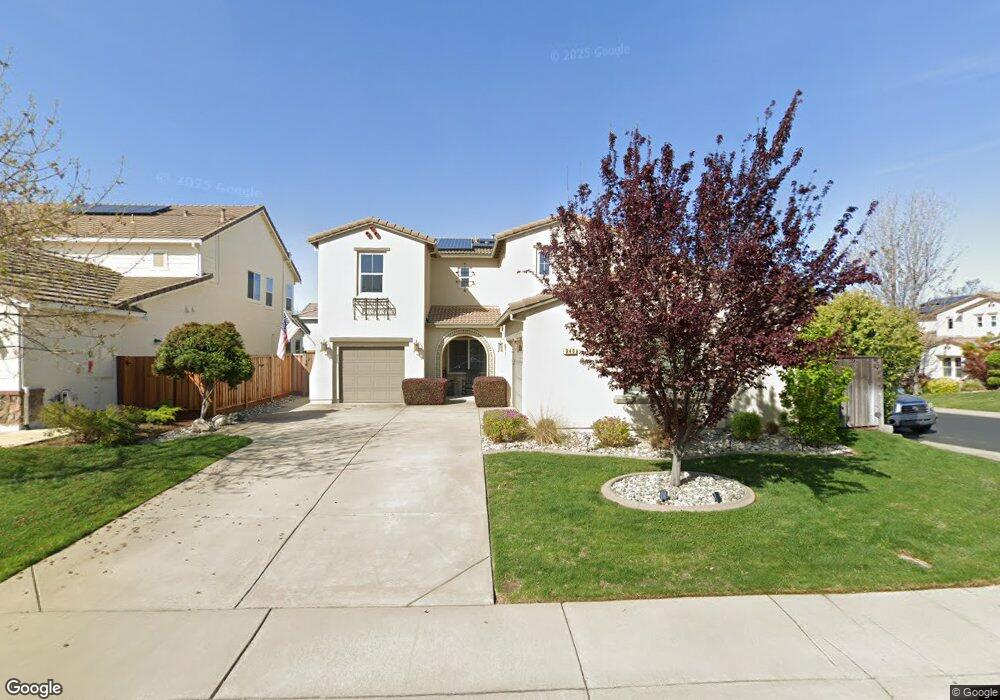
940 Station House Ln Unit 114 Rocklin, CA 95765
Whitney Ranch NeighborhoodEstimated Value: $474,000 - $946,807
4
Beds
5
Baths
3,278
Sq Ft
$242/Sq Ft
Est. Value
About This Home
This home is located at 940 Station House Ln Unit 114, Rocklin, CA 95765 and is currently estimated at $791,952, approximately $241 per square foot. 940 Station House Ln Unit 114 is a home located in Placer County with nearby schools including Sunset Ranch Elementary, Granite Oaks Middle, and Whitney High.
Ownership History
Date
Name
Owned For
Owner Type
Purchase Details
Closed on
Aug 6, 2021
Sold by
Ewing Cynthia A
Bought by
Ewing James E and Ewing Cynthia A
Current Estimated Value
Home Financials for this Owner
Home Financials are based on the most recent Mortgage that was taken out on this home.
Original Mortgage
$383,000
Outstanding Balance
$348,266
Interest Rate
2.9%
Mortgage Type
New Conventional
Estimated Equity
$443,686
Purchase Details
Closed on
Jul 7, 2020
Sold by
Ewing Cynthia A and Ewing James E
Bought by
Ewing James E and Ewing Cynthia A
Purchase Details
Closed on
Mar 1, 2011
Sold by
Ags Sierra Sky Llc
Bought by
Ewing Cynthia A and Ewing James E
Home Financials for this Owner
Home Financials are based on the most recent Mortgage that was taken out on this home.
Original Mortgage
$389,860
Interest Rate
4.75%
Mortgage Type
FHA
Purchase Details
Closed on
Dec 21, 2007
Sold by
Shea Homes Lp
Bought by
Ags Sierra Sky L L C
Create a Home Valuation Report for This Property
The Home Valuation Report is an in-depth analysis detailing your home's value as well as a comparison with similar homes in the area
Home Values in the Area
Average Home Value in this Area
Purchase History
| Date | Buyer | Sale Price | Title Company |
|---|---|---|---|
| Ewing James E | -- | Title Resources Guarantee Co | |
| Ewing James E | -- | None Available | |
| Ewing Cynthia A | $400,000 | Chicago Title Company | |
| Ags Sierra Sky L L C | -- | Fidelity National Title |
Source: Public Records
Mortgage History
| Date | Status | Borrower | Loan Amount |
|---|---|---|---|
| Open | Ewing James E | $383,000 | |
| Closed | Ewing Cynthia A | $389,860 |
Source: Public Records
Tax History Compared to Growth
Tax History
| Year | Tax Paid | Tax Assessment Tax Assessment Total Assessment is a certain percentage of the fair market value that is determined by local assessors to be the total taxable value of land and additions on the property. | Land | Improvement |
|---|---|---|---|---|
| 2025 | $9,014 | $534,331 | $102,487 | $431,844 |
| 2023 | $9,014 | $513,584 | $98,508 | $415,076 |
| 2022 | $8,694 | $503,515 | $96,577 | $406,938 |
| 2021 | $8,482 | $493,643 | $94,684 | $398,959 |
| 2020 | $8,416 | $488,583 | $93,714 | $394,869 |
| 2019 | $8,058 | $459,396 | $91,877 | $367,519 |
| 2018 | $7,854 | $450,389 | $90,076 | $360,313 |
| 2017 | $7,779 | $441,559 | $88,310 | $353,249 |
| 2016 | $7,896 | $432,902 | $86,579 | $346,323 |
| 2015 | $7,780 | $426,400 | $85,279 | $341,121 |
| 2014 | $7,625 | $418,048 | $83,609 | $334,439 |
Source: Public Records
Map
Nearby Homes
- 1617 Arroyo Sierra Way
- 1468 Westwind Way
- 1472 Westwind Way
- 1692 Plan at Westwind at Whitney Ranch
- 2054 Plan at Westwind at Whitney Ranch
- 1343 Plan at Westwind at Whitney Ranch
- 965 Browning Ln
- 809 Big Range Way
- 813 Big Range Way
- 903 Jack Rabbit Ct
- 902 Anvil Cir
- 1250 Whitney Ranch Pkwy Unit 213
- 1250 Whitney Ranch Pkwy Unit 234
- 1240 Whitney Ranch Pkwy Unit 333
- 925 Farm House Ct
- Plan 1787 Modeled at Westhaven at Whitney Ranch
- Plan 1882 at Westhaven at Whitney Ranch
- Plan 1688 Modeled at Westhaven at Whitney Ranch
- Plan 1570 at Westhaven at Whitney Ranch
- 1211 Whitney Ranch Pkwy Unit 1016
- 940 Station House Ln
- 867 Spotted Pony Ln
- 944 Station House Ln
- 864 Spotted Pony Ln
- 862 Spotted Pony Ln
- 866 Spotted Pony Ln
- 946 Station House Ln
- 869 Spotted Pony Ln
- 941 Station House Ln Unit 25
- 943 Station House Ln
- 868 Spotted Pony Ln
- 860 Spotted Pony Ln
- 911 Aubree Ln
- 858 Spotted Pony Ln
- 945 Station House Ln
- 948 Station House Ln
- 871 Spotted Pony Ln
- 870 Spotted Pony Ln
- 947 Station House Ln
- 856 Spotted Pony Ln