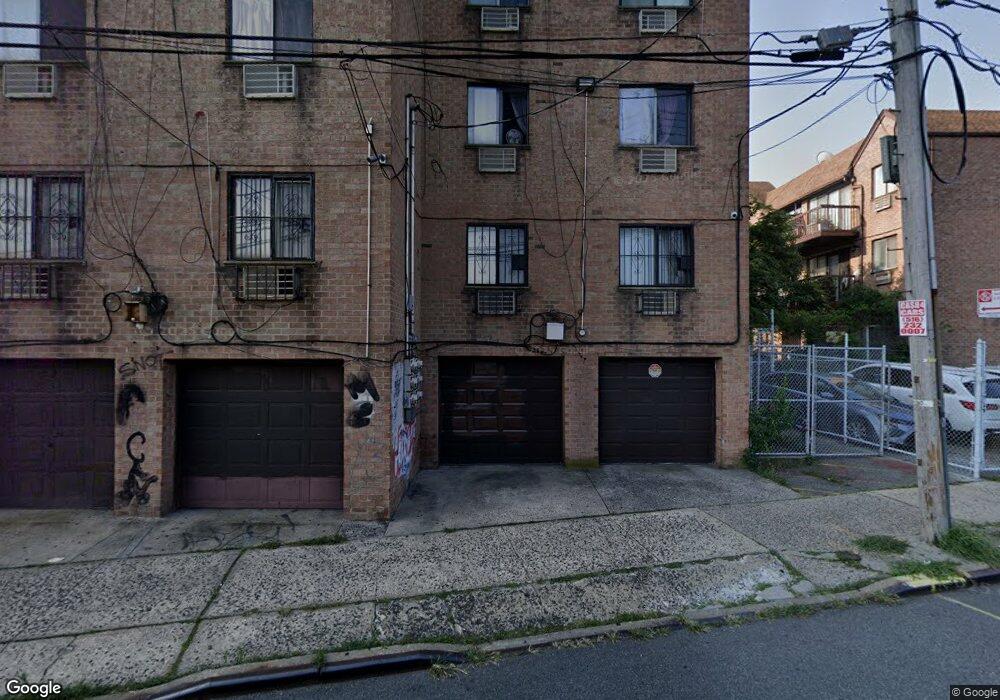
9409 46th Ave Unit 1 Elmhurst, NY 11373
Elmhurst NeighborhoodEstimated Value: $458,000 - $601,363
Studio
--
Bath
787
Sq Ft
$679/Sq Ft
Est. Value
About This Home
This home is located at 9409 46th Ave Unit 1, Elmhurst, NY 11373 and is currently estimated at $534,341, approximately $678 per square foot. 9409 46th Ave Unit 1 is a home located in Queens County with nearby schools including P.S. 110, Is 61 Leonardo Da Vinci, and Newtown High School.
Ownership History
Date
Name
Owned For
Owner Type
Purchase Details
Closed on
Mar 22, 2018
Sold by
Poninska Teresa and Poninski Cezary
Bought by
Chen Wen and Liu Xiuping
Current Estimated Value
Home Financials for this Owner
Home Financials are based on the most recent Mortgage that was taken out on this home.
Original Mortgage
$210,000
Outstanding Balance
$179,953
Interest Rate
4.38%
Mortgage Type
Purchase Money Mortgage
Estimated Equity
$354,388
Purchase Details
Closed on
Apr 15, 2005
Sold by
Chua
Bought by
Poninska Teresa and Poninski Cezary
Home Financials for this Owner
Home Financials are based on the most recent Mortgage that was taken out on this home.
Original Mortgage
$301,500
Interest Rate
6.01%
Mortgage Type
Purchase Money Mortgage
Purchase Details
Closed on
Oct 18, 2004
Sold by
Chang Lourdes Hermosura and Chang Nathan
Bought by
Chua Valerie Padilla
Home Financials for this Owner
Home Financials are based on the most recent Mortgage that was taken out on this home.
Original Mortgage
$220,000
Interest Rate
5.74%
Mortgage Type
Purchase Money Mortgage
Create a Home Valuation Report for This Property
The Home Valuation Report is an in-depth analysis detailing your home's value as well as a comparison with similar homes in the area
Home Values in the Area
Average Home Value in this Area
Purchase History
| Date | Buyer | Sale Price | Title Company |
|---|---|---|---|
| Chen Wen | $515,000 | -- | |
| Poninska Teresa | $335,000 | -- | |
| Chua Valerie Padilla | $275,000 | -- |
Source: Public Records
Mortgage History
| Date | Status | Borrower | Loan Amount |
|---|---|---|---|
| Open | Chen Wen | $210,000 | |
| Previous Owner | Poninska Teresa | $301,500 | |
| Previous Owner | Chua Valerie Padilla | $220,000 |
Source: Public Records
Tax History
| Year | Tax Paid | Tax Assessment Tax Assessment Total Assessment is a certain percentage of the fair market value that is determined by local assessors to be the total taxable value of land and additions on the property. | Land | Improvement |
|---|---|---|---|---|
| 2025 | $2,964 | $16,282 | $133 | $16,149 |
| 2024 | $2,976 | $16,159 | $134 | $16,025 |
| 2023 | $2,781 | $15,245 | $129 | $15,116 |
| 2022 | $2,446 | $33,599 | $306 | $33,293 |
| 2021 | $2,559 | $31,488 | $306 | $31,182 |
| 2020 | $2,576 | $27,316 | $306 | $27,010 |
| 2019 | $2,524 | $23,754 | $306 | $23,448 |
| 2018 | $2,292 | $12,704 | $188 | $12,516 |
| 2017 | $2,143 | $11,985 | $181 | $11,804 |
| 2016 | $1,951 | $11,985 | $181 | $11,804 |
| 2015 | $1,144 | $11,307 | $156 | $11,151 |
| 2014 | $1,144 | $11,222 | $185 | $11,037 |
Source: Public Records
Map
Nearby Homes
- 94-44 45th Ave
- 94-68 45th Ave
- 94-66 45th Ave
- 94-14 Corona Ave
- 43-20 Junction Blvd
- 43-16 Junction Blvd
- 93-09 43rd Ave
- 96-15 Alstyne Ave
- 4131 95th St
- 95-13 42nd Ave
- 9206 43rd Ave
- 9204 43rd Ave
- 97-40 Corona Ave
- 93-10 50th Ave
- 9603 42nd Ave
- 97-69 Corona Ave
- 9235 51st Ave
- 51-02 Junction Blvd
- 91-16 43rd Ave
- 92-29 Lamont Ave Unit 4M
- 9409 46th Ave Unit 3
- 9409 46th Ave Unit 2
- 94- 11 46th Ave Unit 3
- 9411 46th Ave Unit 2
- 9411 46th Ave Unit 1
- 94-11 46th Ave Unit 53
- 94-11 46th Ave Unit 3
- 9411 46th Ave Unit 53B3
- 94-11A 46th Ave Unit 2
- 94-11A 46th Ave Unit 3
- 94-11A 46th Ave Unit 1
- 9411A 46th Ave Unit 3
- 9411A 46th Ave Unit 1
- 94-05A 46th Ave Unit 3
- 94-03A 46th Ave Unit 20G2
- 94-03A 46th Ave Unit 3
- 94-05A 46th Ave Unit 26B1
- 94-05A 46th Ave Unit 30G2
- 94-05A 46th Ave Unit 27B2
- 94-01A 46th Ave Unit 10G2
Your Personal Tour Guide
Ask me questions while you tour the home.