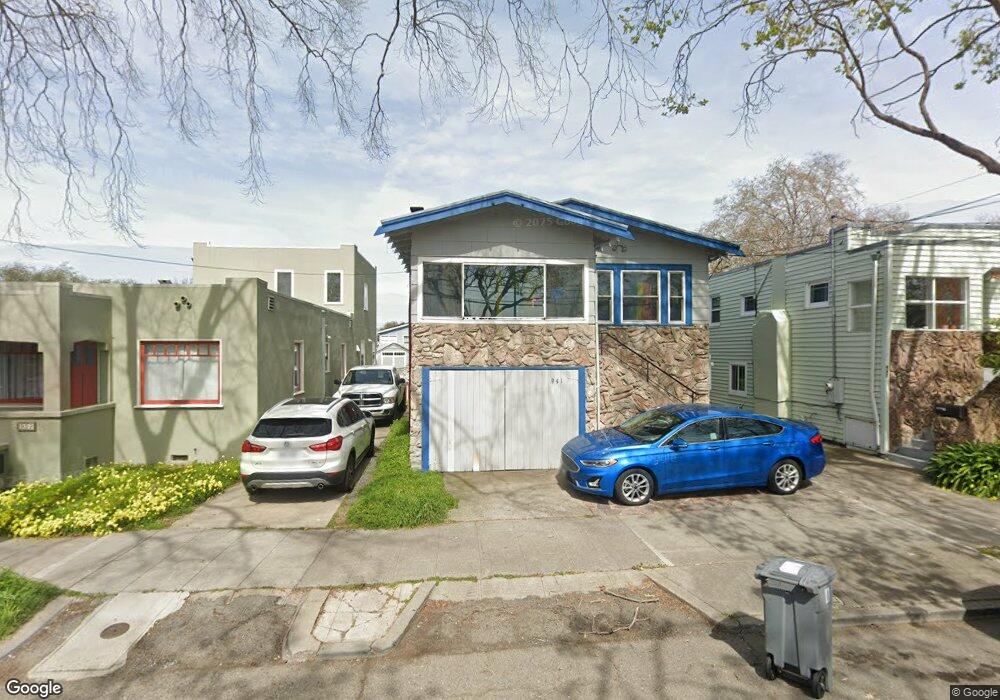
941 Allston Way Berkeley, CA 94710
West Berkeley NeighborhoodEstimated Value: $870,388 - $1,194,000
3
Beds
1
Bath
921
Sq Ft
$1,114/Sq Ft
Est. Value
About This Home
This home is located at 941 Allston Way, Berkeley, CA 94710 and is currently estimated at $1,026,347, approximately $1,114 per square foot. 941 Allston Way is a home located in Alameda County with nearby schools including Rosa Parks Elementary School, Ruth Acty Elementary, and Berkeley Arts Magnet at Whittier School.
Ownership History
Date
Name
Owned For
Owner Type
Purchase Details
Closed on
Oct 25, 2019
Sold by
Spigner Tora R
Bought by
Spigner Tora Rensitt and Tora Rensitt Spigner Revocable
Current Estimated Value
Purchase Details
Closed on
Jul 23, 1996
Sold by
Cragin Eric W
Bought by
Spigner Tora R
Home Financials for this Owner
Home Financials are based on the most recent Mortgage that was taken out on this home.
Original Mortgage
$152,950
Outstanding Balance
$11,206
Interest Rate
8.39%
Estimated Equity
$1,015,141
Purchase Details
Closed on
Dec 15, 1995
Sold by
Household Finance Corp Of Calif
Bought by
Coffey Levanson and Coffey Charles
Home Financials for this Owner
Home Financials are based on the most recent Mortgage that was taken out on this home.
Original Mortgage
$54,000
Interest Rate
7.18%
Purchase Details
Closed on
Aug 10, 1995
Sold by
Prince James M and Prince Myra O
Bought by
Household Finance Corp
Create a Home Valuation Report for This Property
The Home Valuation Report is an in-depth analysis detailing your home's value as well as a comparison with similar homes in the area
Home Values in the Area
Average Home Value in this Area
Purchase History
| Date | Buyer | Sale Price | Title Company |
|---|---|---|---|
| Spigner Tora Rensitt | -- | None Available | |
| Spigner Tora R | -- | Chicago Title Co | |
| Spigner Tora R | $161,000 | Chicago Title Co | |
| Coffey Levanson | $90,000 | -- | |
| Household Finance Corp | $103,418 | Fidelity National Title Ins |
Source: Public Records
Mortgage History
| Date | Status | Borrower | Loan Amount |
|---|---|---|---|
| Open | Spigner Tora R | $152,950 | |
| Previous Owner | Coffey Levanson | $54,000 | |
| Closed | Coffey Levanson | $58,000 |
Source: Public Records
Tax History
| Year | Tax Paid | Tax Assessment Tax Assessment Total Assessment is a certain percentage of the fair market value that is determined by local assessors to be the total taxable value of land and additions on the property. | Land | Improvement |
|---|---|---|---|---|
| 2025 | $6,950 | $255,202 | $78,660 | $183,542 |
| 2024 | $6,950 | $250,061 | $77,118 | $179,943 |
| 2023 | $6,721 | $252,022 | $75,606 | $176,416 |
| 2022 | $6,481 | $240,081 | $74,124 | $172,957 |
| 2021 | $6,456 | $235,237 | $72,671 | $169,566 |
| 2020 | $5,998 | $239,754 | $71,926 | $167,828 |
| 2019 | $5,628 | $235,054 | $70,516 | $164,538 |
| 2018 | $5,487 | $230,447 | $69,134 | $161,313 |
| 2017 | $5,270 | $225,928 | $67,778 | $158,150 |
| 2016 | $4,994 | $221,500 | $66,450 | $155,050 |
| 2015 | $4,904 | $218,174 | $65,452 | $152,722 |
| 2014 | $4,819 | $213,900 | $64,170 | $149,730 |
Source: Public Records
Map
Nearby Homes
- 1050 Allston Way
- 1013 Addison St
- 2013 9th St
- 2220 7th St
- 2241 Ninth St
- 931 Bancroft Way
- 2238 7th St
- 2327 10th St Unit 4
- 2144 Curtis St
- 1039 Channing Way
- 940 Delaware St
- 817 Delaware St
- 1919 Curtis St
- 1128 Delaware St
- 2324 Browning St
- 2512 9th St Unit 10
- 1092 Dwight Way
- 995 Virginia St
- 1118 Dwight Way
- 1728 Curtis St
Your Personal Tour Guide
Ask me questions while you tour the home.