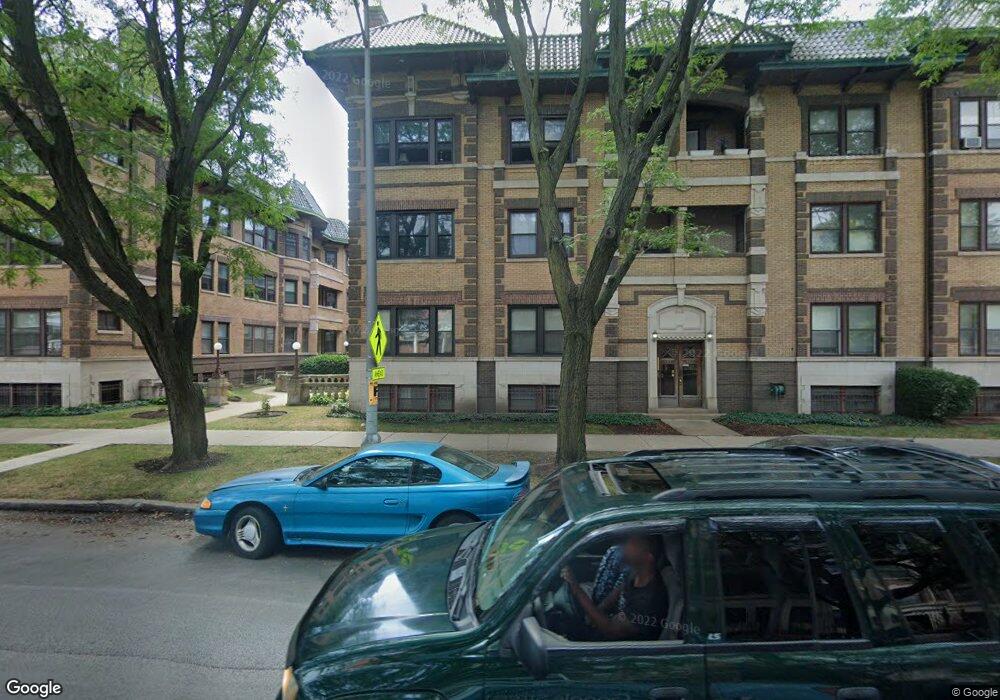
941 E Hyde Park Blvd Unit 9413 Chicago, IL 60615
Hyde Park NeighborhoodEstimated Value: $121,000 - $184,000
1
Bed
1
Bath
--
Sq Ft
20,996
Sq Ft Lot
About This Home
This home is located at 941 E Hyde Park Blvd Unit 9413, Chicago, IL 60615 and is currently estimated at $152,160. 941 E Hyde Park Blvd Unit 9413 is a home located in Cook County with nearby schools including Reavis Elementary Math & Science Specialty School, Kenwood Academy High School, and Bronzeville Academy Charter School.
Ownership History
Date
Name
Owned For
Owner Type
Purchase Details
Closed on
Aug 8, 2018
Sold by
Verhoef Philip A and Kemble Sarah
Bought by
Owens Julian T and Mclntyre Diana
Current Estimated Value
Home Financials for this Owner
Home Financials are based on the most recent Mortgage that was taken out on this home.
Original Mortgage
$109,250
Outstanding Balance
$96,801
Interest Rate
5.75%
Mortgage Type
New Conventional
Estimated Equity
$55,359
Purchase Details
Closed on
May 18, 2009
Sold by
Darrell Ciahnan Q and Darrell Jennifer A
Bought by
Verhoef Philip A
Purchase Details
Closed on
May 14, 2002
Sold by
Shelton Timothy
Bought by
Hunnius David J
Home Financials for this Owner
Home Financials are based on the most recent Mortgage that was taken out on this home.
Original Mortgage
$89,300
Interest Rate
5.75%
Create a Home Valuation Report for This Property
The Home Valuation Report is an in-depth analysis detailing your home's value as well as a comparison with similar homes in the area
Home Values in the Area
Average Home Value in this Area
Purchase History
| Date | Buyer | Sale Price | Title Company |
|---|---|---|---|
| Owens Julian T | $118,000 | Chicago Title Insurance Comp | |
| Verhoef Philip A | $126,500 | None Available | |
| Hunnius David J | $94,000 | Chicago Title Insurance Co |
Source: Public Records
Mortgage History
| Date | Status | Borrower | Loan Amount |
|---|---|---|---|
| Open | Owens Julian T | $109,250 | |
| Previous Owner | Hunnius David J | $89,300 |
Source: Public Records
Tax History
| Year | Tax Paid | Tax Assessment Tax Assessment Total Assessment is a certain percentage of the fair market value that is determined by local assessors to be the total taxable value of land and additions on the property. | Land | Improvement |
|---|---|---|---|---|
| 2025 | $2,329 | $12,990 | $2,860 | $10,130 |
| 2024 | $2,329 | $12,990 | $2,860 | $10,130 |
| 2023 | $2,262 | $11,000 | $2,308 | $8,692 |
| 2022 | $2,262 | $11,000 | $2,308 | $8,692 |
| 2021 | $2,212 | $10,999 | $2,308 | $8,691 |
| 2020 | $1,982 | $8,899 | $1,845 | $7,054 |
| 2019 | $1,947 | $9,690 | $1,845 | $7,845 |
| 2018 | $1,236 | $9,690 | $1,845 | $7,845 |
| 2017 | $491 | $5,657 | $1,522 | $4,135 |
| 2016 | $633 | $5,657 | $1,522 | $4,135 |
| 2015 | $556 | $5,657 | $1,522 | $4,135 |
| 2014 | $677 | $6,215 | $1,245 | $4,970 |
| 2013 | $881 | $7,472 | $1,245 | $6,227 |
Source: Public Records
Map
Nearby Homes
- 951 E Hyde Park Blvd
- 5424 S Ingleside Ave
- 4730 S Drexel Ave Unit 3N
- 5200 S Ellis Ave Unit 202
- 5132 S Drexel Ave Unit 2D
- 5052 S Drexel Blvd Unit 3C
- 840 E 52nd St Unit 1E
- 838 E 52nd St Unit 1W
- 825 E Drexel Square Unit 2
- 1059 E Hyde Park Blvd Unit 1
- 836 E 52nd St
- 5133 S Greenwood Ave Unit 2
- 823 E Drexel Square
- 843 E 52nd St Unit 1
- 5124 S University Ave
- 4959 S Greenwood Ave
- 5230 S University Ave Unit D
- 5309 S Greenwood Ave
- 1155 E Hyde Park Blvd Unit 2F
- 5110 S Woodlawn Ave Unit 3H
- 941 E Hyde Park Blvd Unit 9412
- 941 E Hyde Park Blvd Unit 9411
- 941 E Hyde Park Blvd Unit 1
- 943 E Hyde Park Blvd Unit 9433
- 943 E Hyde Park Blvd Unit 9431
- 943 E Hyde Park Blvd Unit 9432
- 943 E Hyde Park Blvd Unit 1
- 943 E Hyde Park Blvd
- 943 E Hyde Park Blvd Unit 3
- 943 E Hyde Park Blvd Unit 2
- 939 E Hyde Park Blvd Unit 9392
- 939 E Hyde Park Blvd Unit 9391
- 939 E Hyde Park Blvd Unit 9393
- 939 E Hyde Park Blvd Unit 2
- 939 E Hyde Park Blvd Unit 1W
- 945 E Hyde Park Blvd Unit 9452
- 945 E Hyde Park Blvd Unit 9453
- 945 E Hyde Park Blvd Unit 9451
- 945 E Hyde Park Blvd Unit 2
- 945 E Hyde Park Blvd Unit 3
Your Personal Tour Guide
Ask me questions while you tour the home.