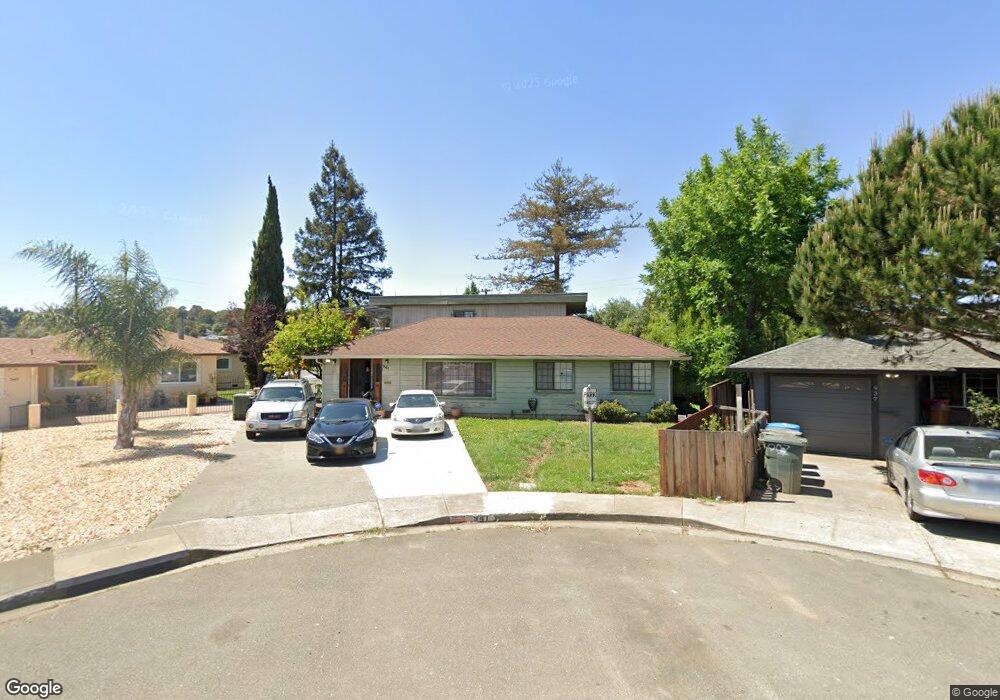
941 Pine St Vallejo, CA 94590
South Vallejo NeighborhoodEstimated Value: $542,000 - $671,000
4
Beds
3
Baths
2,928
Sq Ft
$212/Sq Ft
Est. Value
About This Home
This home is located at 941 Pine St, Vallejo, CA 94590 and is currently estimated at $621,351, approximately $212 per square foot. 941 Pine St is a home located in Solano County with nearby schools including Grace Patterson Elementary School, Vallejo High School, and Mustard Seed Preschool and Kindergarten.
Ownership History
Date
Name
Owned For
Owner Type
Purchase Details
Closed on
Jun 14, 2024
Sold by
Jones Vera M
Bought by
Vera M Jones Family Trust and Jones
Current Estimated Value
Purchase Details
Closed on
Dec 27, 2002
Sold by
Davis Ellis R and Davis Luzviminda G
Bought by
Jones Kenneth D and Jones Vera M
Home Financials for this Owner
Home Financials are based on the most recent Mortgage that was taken out on this home.
Original Mortgage
$276,000
Interest Rate
5.87%
Purchase Details
Closed on
Apr 25, 1996
Sold by
Charles Ida Mae
Bought by
Davis Ellis R and Davis Luzviminda G
Home Financials for this Owner
Home Financials are based on the most recent Mortgage that was taken out on this home.
Original Mortgage
$141,565
Interest Rate
7%
Mortgage Type
FHA
Create a Home Valuation Report for This Property
The Home Valuation Report is an in-depth analysis detailing your home's value as well as a comparison with similar homes in the area
Home Values in the Area
Average Home Value in this Area
Purchase History
| Date | Buyer | Sale Price | Title Company |
|---|---|---|---|
| Vera M Jones Family Trust | -- | None Listed On Document | |
| Jones Kenneth D | $345,000 | Chicago | |
| Davis Ellis R | $143,000 | North American Title Co |
Source: Public Records
Mortgage History
| Date | Status | Borrower | Loan Amount |
|---|---|---|---|
| Previous Owner | Jones Kenneth D | $276,000 | |
| Previous Owner | Davis Ellis R | $141,565 | |
| Closed | Jones Kenneth D | $69,000 |
Source: Public Records
Tax History
| Year | Tax Paid | Tax Assessment Tax Assessment Total Assessment is a certain percentage of the fair market value that is determined by local assessors to be the total taxable value of land and additions on the property. | Land | Improvement |
|---|---|---|---|---|
| 2025 | $6,599 | $499,667 | $94,136 | $405,531 |
| 2024 | $6,599 | $489,871 | $92,291 | $397,580 |
| 2023 | $6,105 | $480,267 | $90,482 | $389,785 |
| 2022 | $6,181 | $470,851 | $88,708 | $382,143 |
| 2021 | $6,046 | $461,619 | $86,969 | $374,650 |
| 2020 | $6,095 | $456,887 | $86,078 | $370,809 |
| 2019 | $5,930 | $447,930 | $84,391 | $363,539 |
| 2018 | $5,564 | $439,148 | $82,737 | $356,411 |
| 2017 | $4,718 | $375,000 | $48,000 | $327,000 |
| 2016 | $3,914 | $347,000 | $48,000 | $299,000 |
| 2015 | $3,853 | $341,000 | $51,000 | $290,000 |
| 2014 | $3,152 | $278,000 | $42,000 | $236,000 |
Source: Public Records
Map
Nearby Homes
- 1012 Pine St
- 942 5th St
- 314 San Marcus Dr
- 225 Gary Cir
- 816 Grant St
- 410 San Gabriel Dr Unit 410
- 105 Laguna St
- 121 Lincoln Rd W
- 108 Mesa St
- 173 Jordan St
- 246 Jordan St
- 4 Woodrow Ave
- 615 Mclane St
- 414 Mclane St
- 199 Sandy Beach Rd
- 435 Grant St
- 207 Wilshire Ave
- 1940 Magazine St
- 412 Mclane St
- 139 Laurel St
Your Personal Tour Guide
Ask me questions while you tour the home.