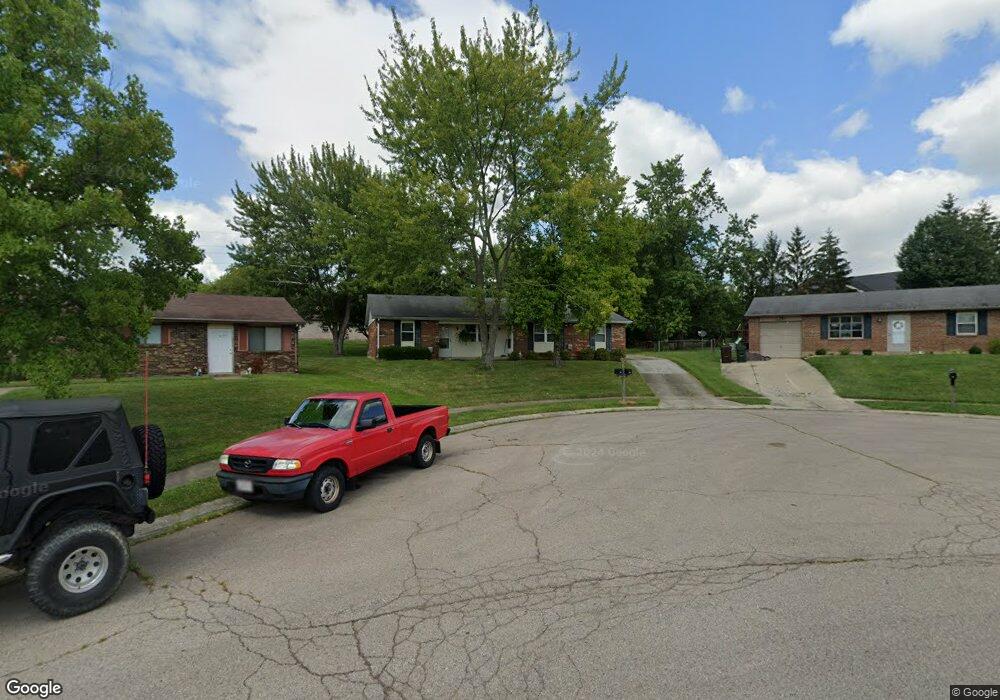
941 Sharon Dr Unit A&B Lebanon, OH 45036
Estimated Value: $255,000 - $275,600
4
Beds
2
Baths
1,896
Sq Ft
$142/Sq Ft
Est. Value
About This Home
This home is located at 941 Sharon Dr Unit A&B, Lebanon, OH 45036 and is currently estimated at $269,150, approximately $141 per square foot. 941 Sharon Dr Unit A&B is a home located in Warren County with nearby schools including Bowman Primary School, Berry Intermediate School, and Donovan Elementary School.
Ownership History
Date
Name
Owned For
Owner Type
Purchase Details
Closed on
Jan 28, 2020
Sold by
Berrey Matthew J and Berrey Jennifer L
Bought by
Bluehaus Properties Llc
Current Estimated Value
Purchase Details
Closed on
Mar 1, 2016
Sold by
Jw Snider Properties Llc
Bought by
Berrey Matthew J and Berrey Berrey
Home Financials for this Owner
Home Financials are based on the most recent Mortgage that was taken out on this home.
Interest Rate
3.62%
Purchase Details
Closed on
Jun 13, 2014
Sold by
Snider Joann E
Bought by
Jw Snider Properties Llc
Purchase Details
Closed on
May 27, 2008
Sold by
Snider Willard G and Snider Joann M
Bought by
Snider Willard G and Snider Joann E
Purchase Details
Closed on
Feb 4, 1983
Sold by
Wolford Wolford and Wolford Richard C
Bought by
Willard Snider and Willard G.
Purchase Details
Closed on
Dec 15, 1980
Sold by
Walnut Hills Company
Purchase Details
Closed on
Aug 21, 1978
Sold by
Walnut Hills Company
Create a Home Valuation Report for This Property
The Home Valuation Report is an in-depth analysis detailing your home's value as well as a comparison with similar homes in the area
Home Values in the Area
Average Home Value in this Area
Purchase History
| Date | Buyer | Sale Price | Title Company |
|---|---|---|---|
| Bluehaus Properties Llc | -- | None Available | |
| Berrey Matthew J | $145,000 | -- | |
| Jw Snider Properties Llc | -- | None Available | |
| Snider Willard G | -- | None Available | |
| Willard Snider | $55,000 | -- | |
| -- | $50,000 | -- | |
| -- | -- | -- |
Source: Public Records
Mortgage History
| Date | Status | Borrower | Loan Amount |
|---|---|---|---|
| Previous Owner | Berrey Matthew J | -- |
Source: Public Records
Tax History Compared to Growth
Tax History
| Year | Tax Paid | Tax Assessment Tax Assessment Total Assessment is a certain percentage of the fair market value that is determined by local assessors to be the total taxable value of land and additions on the property. | Land | Improvement |
|---|---|---|---|---|
| 2024 | $2,842 | $66,900 | $8,750 | $58,150 |
| 2023 | $2,949 | $62,422 | $10,762 | $51,660 |
| 2022 | $3,070 | $62,423 | $10,763 | $51,660 |
| 2021 | $2,900 | $62,423 | $10,763 | $51,660 |
| 2020 | $2,791 | $50,750 | $8,750 | $42,000 |
| 2019 | $2,804 | $50,750 | $8,750 | $42,000 |
| 2018 | $2,412 | $50,750 | $8,750 | $42,000 |
| 2017 | $2,262 | $42,721 | $7,480 | $35,242 |
| 2016 | $2,334 | $42,721 | $7,480 | $35,242 |
| 2015 | $2,351 | $42,721 | $7,480 | $35,242 |
| 2014 | $2,472 | $43,130 | $7,480 | $35,650 |
| 2013 | $2,386 | $50,450 | $8,750 | $41,700 |
Source: Public Records
Map
Nearby Homes
- 1 Dryhill Ct
- 1443 N Broadway St
- 1112 Hubbell Ct
- 917 Kerns Dr
- 911 Birchwood Dr
- 908 Hartz Dr
- 11 Roxie Ct
- 465 Creekside Dr
- 5 Acres Lot D Phillips Rd
- 409 Bethpage Way Unit 7-301
- 5 Acres Ave
- 409 Bethpage Way
- 1033 Country Creek Dr
- 364 Grey's Run
- 351 Grey's Run
- 376 Grey's Run
- 531 Quail Ct
- 532 French Run Ct
- 19 Hathaway Commons
- 229 Dickens Ct
- 941 Sharon Dr
- 6 Raintree Trail
- 939 Sharon Dr
- 940 N Broadway St
- 942 N Broadway St
- 938 N Broadway St
- 8 Raintree Trail
- 4 E Northwood Dr
- 2 North Ln
- 2 North Ln Unit 48
- 938 Sharon Dr
- 10 Raintree Trail
- 11 Raintree Trail
- 12 Raintree Trail
- 936 Sharon Dr
- 3 E Northwood Dr
- 1 E Northwood Dr
- 1051 Winding Way
- 14 Raintree Trail
- 934 Sharon Dr