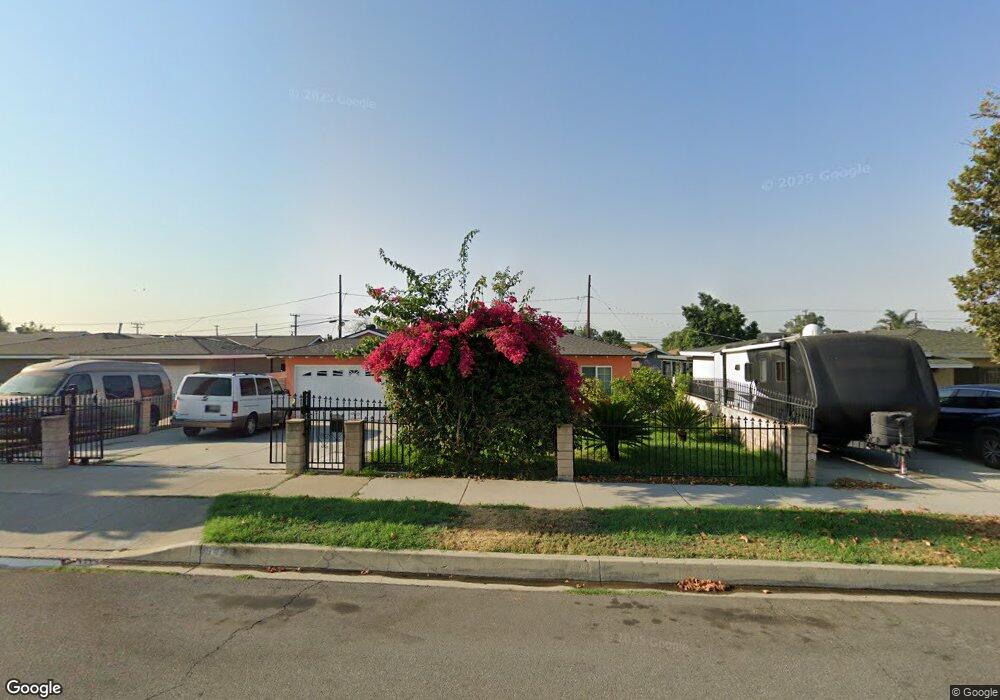
942 E El Morado Ct Ontario, CA 91764
Estimated Value: $580,000 - $597,521
3
Beds
2
Baths
1,040
Sq Ft
$565/Sq Ft
Est. Value
About This Home
This home is located at 942 E El Morado Ct, Ontario, CA 91764 and is currently estimated at $587,380, approximately $564 per square foot. 942 E El Morado Ct is a home located in San Bernardino County with nearby schools including Del Norte Elementary School, Vina Danks Middle, and Chaffey High School.
Ownership History
Date
Name
Owned For
Owner Type
Purchase Details
Closed on
Jan 22, 2002
Sold by
Ledezma Oscar M and Ledezma Evangelina
Bought by
Ledezma Oscar M and Ledezma Evangelina
Current Estimated Value
Home Financials for this Owner
Home Financials are based on the most recent Mortgage that was taken out on this home.
Original Mortgage
$85,500
Interest Rate
7.17%
Purchase Details
Closed on
Dec 12, 1995
Sold by
Hud
Bought by
Ledezma Oscar M and Ledezma Evangelina
Home Financials for this Owner
Home Financials are based on the most recent Mortgage that was taken out on this home.
Original Mortgage
$86,403
Interest Rate
7.18%
Mortgage Type
FHA
Purchase Details
Closed on
Jul 19, 1995
Sold by
Urbina Martin and Urbina Maria I
Bought by
Union Planters Bank and Union Planters National Bank
Purchase Details
Closed on
Jul 13, 1995
Sold by
Union Planters National Bank
Bought by
Hud
Create a Home Valuation Report for This Property
The Home Valuation Report is an in-depth analysis detailing your home's value as well as a comparison with similar homes in the area
Home Values in the Area
Average Home Value in this Area
Purchase History
| Date | Buyer | Sale Price | Title Company |
|---|---|---|---|
| Ledezma Oscar M | -- | Fidelity National Title Ins | |
| Ledezma Oscar M | $88,500 | Chicago Title Co | |
| Union Planters Bank | $136,800 | Stewart Title | |
| Hud | -- | Stewart Title |
Source: Public Records
Mortgage History
| Date | Status | Borrower | Loan Amount |
|---|---|---|---|
| Closed | Ledezma Oscar M | $85,500 | |
| Closed | Ledezma Oscar M | $86,403 |
Source: Public Records
Tax History Compared to Growth
Tax History
| Year | Tax Paid | Tax Assessment Tax Assessment Total Assessment is a certain percentage of the fair market value that is determined by local assessors to be the total taxable value of land and additions on the property. | Land | Improvement |
|---|---|---|---|---|
| 2025 | $1,588 | $146,228 | $49,837 | $96,391 |
| 2024 | $1,588 | $143,361 | $48,860 | $94,501 |
| 2023 | $1,543 | $140,550 | $47,902 | $92,648 |
| 2022 | $1,523 | $137,794 | $46,963 | $90,831 |
| 2021 | $1,513 | $135,092 | $46,042 | $89,050 |
| 2020 | $1,487 | $133,707 | $45,570 | $88,137 |
| 2019 | $1,474 | $131,085 | $44,676 | $86,409 |
| 2018 | $1,454 | $128,515 | $43,800 | $84,715 |
| 2017 | $1,402 | $125,995 | $42,941 | $83,054 |
| 2016 | $1,347 | $123,524 | $42,099 | $81,425 |
| 2015 | $1,338 | $121,669 | $41,467 | $80,202 |
| 2014 | $1,296 | $119,286 | $40,655 | $78,631 |
Source: Public Records
Map
Nearby Homes
- 948 E El Morado Ct
- 936 E El Morado Ct
- 954 E El Morado Ct
- 932 E El Morado Ct
- 947 E G St
- 937 E G St
- 951 E G St
- 739 Florence Ave
- 933 E G St
- 956 E El Morado Ct
- 955 E G St
- 720 N Greenwood Ave
- 724 N Greenwood Ave
- 738 Florence Ave
- 714 N Greenwood Ave
- 958 E El Morado Ct
- 745 Florence Ave
- 933 E El Morado Ct
- 921 E G St
- 965 E G St