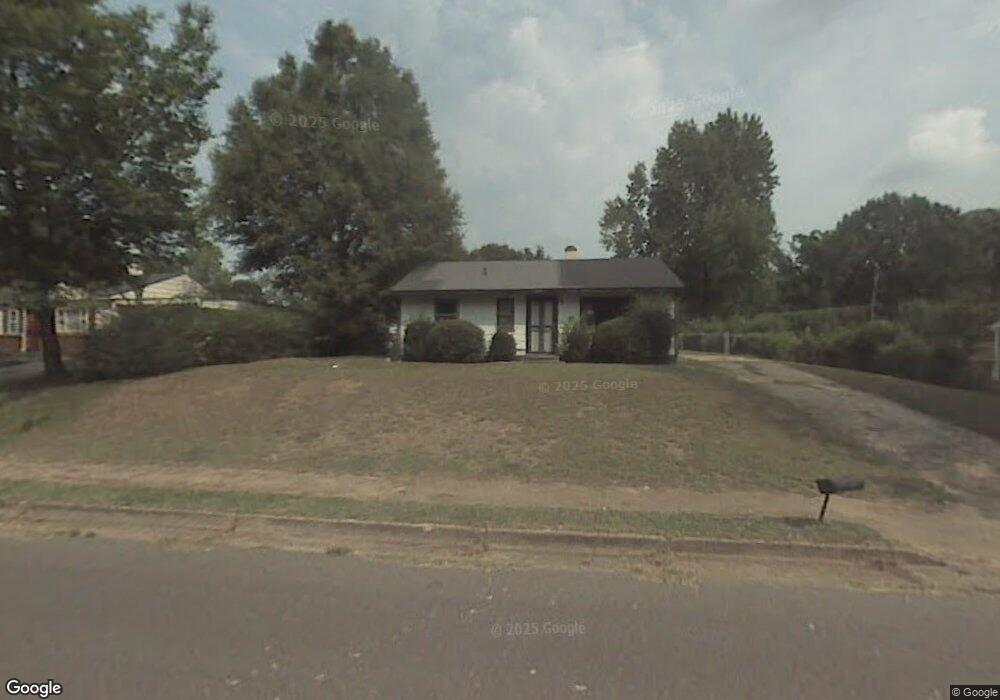
942 Par Ave Memphis, TN 38127
Frayser NeighborhoodEstimated Value: $103,000 - $112,000
3
Beds
1
Bath
875
Sq Ft
$122/Sq Ft
Est. Value
About This Home
This home is located at 942 Par Ave, Memphis, TN 38127 and is currently estimated at $106,940, approximately $122 per square foot. 942 Par Ave is a home located in Shelby County with nearby schools including Westside Elementary School, Trezevant High School, and Compass Community School Frayser Campus.
Ownership History
Date
Name
Owned For
Owner Type
Purchase Details
Closed on
Apr 11, 2024
Sold by
Popwell Investments Llc Iii
Bought by
Mid South Homebuyers Llc
Current Estimated Value
Purchase Details
Closed on
Dec 30, 2021
Sold by
Popwell Arthur Jay and Popwell Arthur J
Bought by
Popwell Investments Llc Iii
Purchase Details
Closed on
Feb 22, 2005
Sold by
Popwell Betsy L
Bought by
Popwell Arthur J
Purchase Details
Closed on
Aug 29, 1995
Bought by
Davis Patricia F
Create a Home Valuation Report for This Property
The Home Valuation Report is an in-depth analysis detailing your home's value as well as a comparison with similar homes in the area
Home Values in the Area
Average Home Value in this Area
Purchase History
| Date | Buyer | Sale Price | Title Company |
|---|---|---|---|
| Mid South Homebuyers Llc | $38,000 | None Listed On Document | |
| Popwell Investments Llc Iii | -- | None Available | |
| Popwell Arthur J | -- | Lenders Title & Escrow Llc | |
| Davis Patricia F | $21,034 | -- |
Source: Public Records
Tax History Compared to Growth
Tax History
| Year | Tax Paid | Tax Assessment Tax Assessment Total Assessment is a certain percentage of the fair market value that is determined by local assessors to be the total taxable value of land and additions on the property. | Land | Improvement |
|---|---|---|---|---|
| 2025 | $324 | $22,925 | $1,625 | $21,300 |
| 2024 | $324 | $9,550 | $1,275 | $8,275 |
| 2023 | $324 | $9,550 | $1,275 | $8,275 |
| 2022 | $582 | $9,550 | $1,275 | $8,275 |
| 2021 | $589 | $9,550 | $1,275 | $8,275 |
| 2020 | $464 | $6,400 | $1,275 | $5,125 |
| 2019 | $205 | $6,400 | $1,275 | $5,125 |
| 2018 | $205 | $6,400 | $1,275 | $5,125 |
| 2017 | $209 | $6,400 | $1,275 | $5,125 |
| 2016 | $339 | $7,750 | $0 | $0 |
| 2014 | $339 | $7,750 | $0 | $0 |
Source: Public Records
Map
Nearby Homes