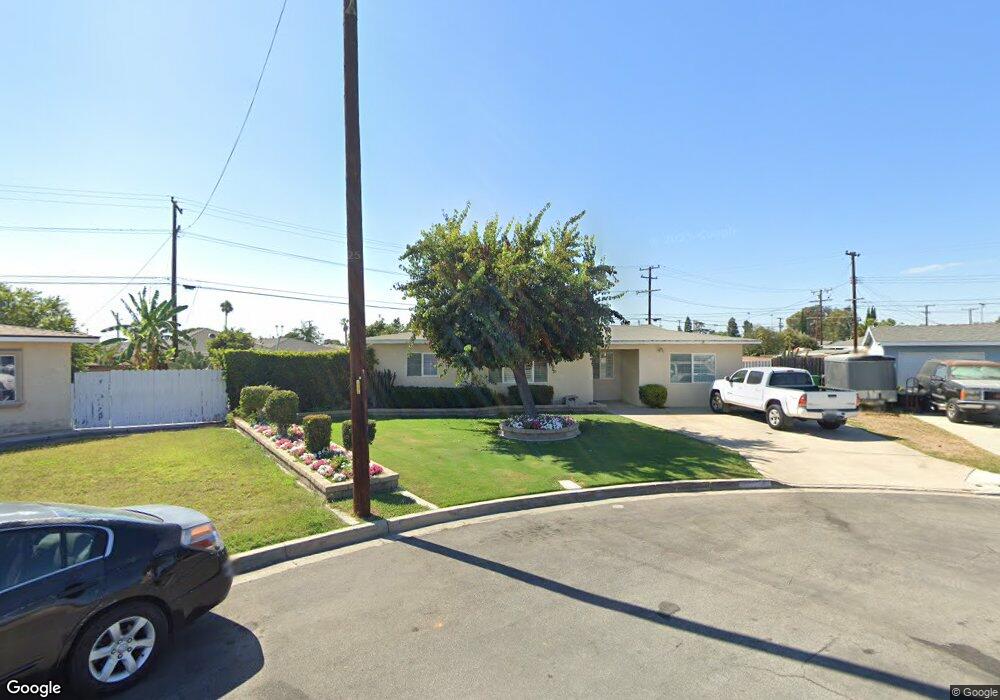
9425 Mirage Ave Westminster, CA 92683
Little Saigon NeighborhoodEstimated Value: $959,000 - $1,144,000
4
Beds
2
Baths
1,585
Sq Ft
$653/Sq Ft
Est. Value
About This Home
This home is located at 9425 Mirage Ave, Westminster, CA 92683 and is currently estimated at $1,034,473, approximately $652 per square foot. 9425 Mirage Ave is a home located in Orange County with nearby schools including Merton E. Hill Elementary School, Donald S. Jordan Intermediate School, and Bolsa Grande High School.
Ownership History
Date
Name
Owned For
Owner Type
Purchase Details
Closed on
Jun 4, 2024
Sold by
Casey Vaugh and Casey Teresa
Bought by
Casey Teresa and Casey Vaughn Ray
Current Estimated Value
Home Financials for this Owner
Home Financials are based on the most recent Mortgage that was taken out on this home.
Original Mortgage
$100,000
Outstanding Balance
$98,107
Interest Rate
7.17%
Mortgage Type
Credit Line Revolving
Estimated Equity
$936,366
Purchase Details
Closed on
Aug 3, 2001
Sold by
Casey Teresa
Bought by
Casey Vaughn and Casey Teresa
Home Financials for this Owner
Home Financials are based on the most recent Mortgage that was taken out on this home.
Original Mortgage
$50,000
Interest Rate
7.1%
Mortgage Type
Credit Line Revolving
Purchase Details
Closed on
Dec 23, 1999
Sold by
Gonzales Sarah O Trust and Teresa
Bought by
Casey Teresa
Purchase Details
Closed on
Dec 21, 1993
Sold by
Gonzales Sarah O
Bought by
Gonzales Sarah O and Sarah O Gonzales Trust
Create a Home Valuation Report for This Property
The Home Valuation Report is an in-depth analysis detailing your home's value as well as a comparison with similar homes in the area
Home Values in the Area
Average Home Value in this Area
Purchase History
| Date | Buyer | Sale Price | Title Company |
|---|---|---|---|
| Casey Teresa | -- | Monarch Title | |
| Casey Vaughn | -- | American Title Co | |
| Casey Teresa | -- | -- | |
| Gonzales Sarah O | -- | -- | |
| Gonzales Sarah O | -- | -- |
Source: Public Records
Mortgage History
| Date | Status | Borrower | Loan Amount |
|---|---|---|---|
| Open | Casey Teresa | $100,000 | |
| Previous Owner | Casey Vaughn | $50,000 |
Source: Public Records
Tax History
| Year | Tax Paid | Tax Assessment Tax Assessment Total Assessment is a certain percentage of the fair market value that is determined by local assessors to be the total taxable value of land and additions on the property. | Land | Improvement |
|---|---|---|---|---|
| 2025 | $1,658 | $85,768 | $26,168 | $59,600 |
| 2024 | $1,658 | $84,087 | $25,655 | $58,432 |
| 2023 | $1,581 | $82,439 | $25,152 | $57,287 |
| 2022 | $1,542 | $80,823 | $24,659 | $56,164 |
| 2021 | $1,505 | $79,239 | $24,176 | $55,063 |
| 2020 | $1,489 | $78,427 | $23,928 | $54,499 |
| 2019 | $1,471 | $76,890 | $23,459 | $53,431 |
| 2018 | $1,450 | $75,383 | $22,999 | $52,384 |
| 2017 | $1,434 | $73,905 | $22,548 | $51,357 |
| 2016 | $1,392 | $72,456 | $22,106 | $50,350 |
| 2015 | $1,375 | $71,368 | $21,774 | $49,594 |
| 2014 | $1,349 | $69,970 | $21,347 | $48,623 |
Source: Public Records
Map
Nearby Homes
- 14172 Swan St
- 9200 Westminster Blvd Unit 71
- 9121 Reading Ave
- 9141 Jennrich Ave
- 14362 Bushard St Unit 17
- 9619 Hazard Ave
- 13950 Magnolia St
- 9906 13th St
- 8952 Mcclure Ave
- 8922 Jennrich Ave
- 9180 Tropic Dr
- 14081 Magnolia St Unit 140
- 8784 Hewitt Place Unit 12
- 8842 Enloe Ave
- 14068 Tiffany Dr
- 14131 Grand Meadows
- 14642 Birch St
- 9151 Carl Ln
- 9411 Russell Ave
- 9851 Bolsa Ave Unit 58
- 9431 Mirage Ave
- 14112 Swan St
- 14102 Swan St
- 9426 Mirage Ave
- 9432 Sutherland Way
- 14122 Swan St
- 9451 Mirage Ave
- 9426 Sutherland Way
- 9402 Mirage Ave
- 9432 Mirage Ave
- 9406 Mirage Ave
- 14082 Swan St
- 14132 Swan St
- 9452 Sutherland Way
- 9452 Mirage Ave
- 9461 Mirage Ave
- 9431 Reading Ave
- 9462 Mirage Ave
- 9462 Sutherland Way
- 14142 Swan St
Your Personal Tour Guide
Ask me questions while you tour the home.