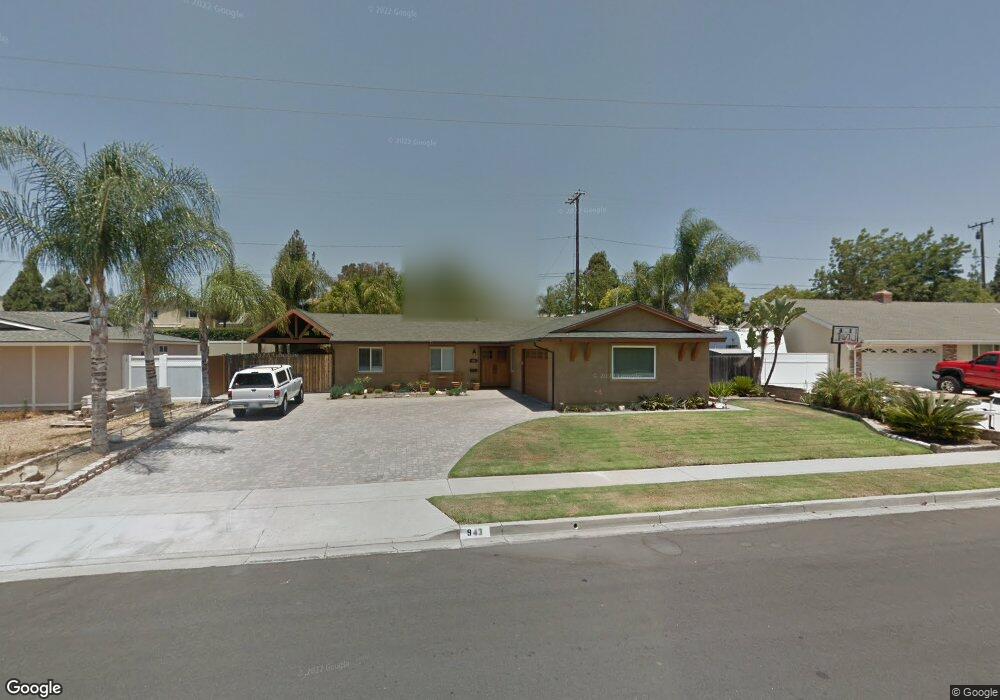
943 Euclid Ave Camarillo, CA 93010
Estimated Value: $825,035 - $889,000
4
Beds
2
Baths
1,315
Sq Ft
$648/Sq Ft
Est. Value
About This Home
This home is located at 943 Euclid Ave, Camarillo, CA 93010 and is currently estimated at $852,509, approximately $648 per square foot. 943 Euclid Ave is a home located in Ventura County with nearby schools including Dos Caminos Elementary School, Monte Vista Middle School, and Adolfo Camarillo High School.
Ownership History
Date
Name
Owned For
Owner Type
Purchase Details
Closed on
Dec 15, 2020
Sold by
Todd Mark Alan and Todd Ginger
Bought by
Todd Mark A and Todd Ginger
Current Estimated Value
Home Financials for this Owner
Home Financials are based on the most recent Mortgage that was taken out on this home.
Original Mortgage
$315,000
Outstanding Balance
$254,835
Interest Rate
2.71%
Mortgage Type
New Conventional
Estimated Equity
$597,674
Purchase Details
Closed on
Jun 25, 2018
Sold by
Todd Mark and Todd Ginger
Bought by
Todd Mark A and Todd Ginger
Purchase Details
Closed on
Jun 21, 1999
Sold by
Garcia Louie Z and Garcia Raymond
Bought by
Wagner Charles H and Wagner Nancy A
Home Financials for this Owner
Home Financials are based on the most recent Mortgage that was taken out on this home.
Original Mortgage
$128,000
Interest Rate
7.05%
Mortgage Type
Balloon
Create a Home Valuation Report for This Property
The Home Valuation Report is an in-depth analysis detailing your home's value as well as a comparison with similar homes in the area
Home Values in the Area
Average Home Value in this Area
Purchase History
| Date | Buyer | Sale Price | Title Company |
|---|---|---|---|
| Todd Mark A | -- | Servicelink | |
| Todd Mark Alan | -- | Servicelink | |
| Todd Mark A | -- | None Available | |
| Todd Mark | -- | None Available | |
| Wagner Charles H | $160,000 | Fidelity National Title Co |
Source: Public Records
Mortgage History
| Date | Status | Borrower | Loan Amount |
|---|---|---|---|
| Open | Todd Mark Alan | $315,000 | |
| Closed | Todd Mark A | $315,000 | |
| Previous Owner | Wagner Charles H | $128,000 |
Source: Public Records
Tax History
| Year | Tax Paid | Tax Assessment Tax Assessment Total Assessment is a certain percentage of the fair market value that is determined by local assessors to be the total taxable value of land and additions on the property. | Land | Improvement |
|---|---|---|---|---|
| 2025 | $4,900 | $449,944 | $152,475 | $297,469 |
| 2024 | $4,900 | $441,122 | $149,485 | $291,637 |
| 2023 | $4,724 | $432,473 | $146,554 | $285,919 |
| 2022 | $4,708 | $423,994 | $143,681 | $280,313 |
| 2021 | $4,539 | $415,681 | $140,864 | $274,817 |
| 2020 | $4,521 | $411,421 | $139,421 | $272,000 |
| 2019 | $4,499 | $403,355 | $136,688 | $266,667 |
| 2018 | $4,416 | $395,447 | $134,008 | $261,439 |
| 2017 | $4,156 | $387,694 | $131,381 | $256,313 |
| 2016 | $4,055 | $380,093 | $128,805 | $251,288 |
| 2015 | $4,012 | $374,385 | $126,871 | $247,514 |
| 2014 | $3,918 | $367,053 | $124,387 | $242,666 |
Source: Public Records
Map
Nearby Homes
- 1487 Nordman Dr
- 1075 Seybolt Ave
- 157 Lantana St
- 1574 Habra Ct
- 253 Reddington Ct
- 1767 Dunnigan St
- 1709 Las Posas Rd
- 813 N Calle Circulo
- 1623 Regent St
- 1682 Darnell Ct
- 25 Encino Ave
- 154 Cerro Crest Dr
- 35 Estaban Dr
- 1654 Edgewater Ln
- 91 Calle Escalon
- 560 Chapala Dr
- 85 Crestview Ave
- 2103 Euclid Ave
- 375 W Highland Dr
- 2174 Wilcox St
- 959 Euclid Ave
- 925 Euclid Ave
- 975 Euclid Ave
- 909 Euclid Ave
- 942 Euclid Ave
- 958 Euclid Ave
- 924 Euclid Ave
- 974 Euclid Ave
- 832 Calle Portilla
- 908 Euclid Ave
- 824 Calle Portilla
- 990 Euclid Ave
- 991 Euclid Ave
- 890 Calle Portilla
- 808 Calle Portilla
- 1413 Nordman Dr
- 1461 Nordman Dr
- 1390 Skeel Dr
- 904 Calle Portilla
- 1391 Nordman Dr
Your Personal Tour Guide
Ask me questions while you tour the home.