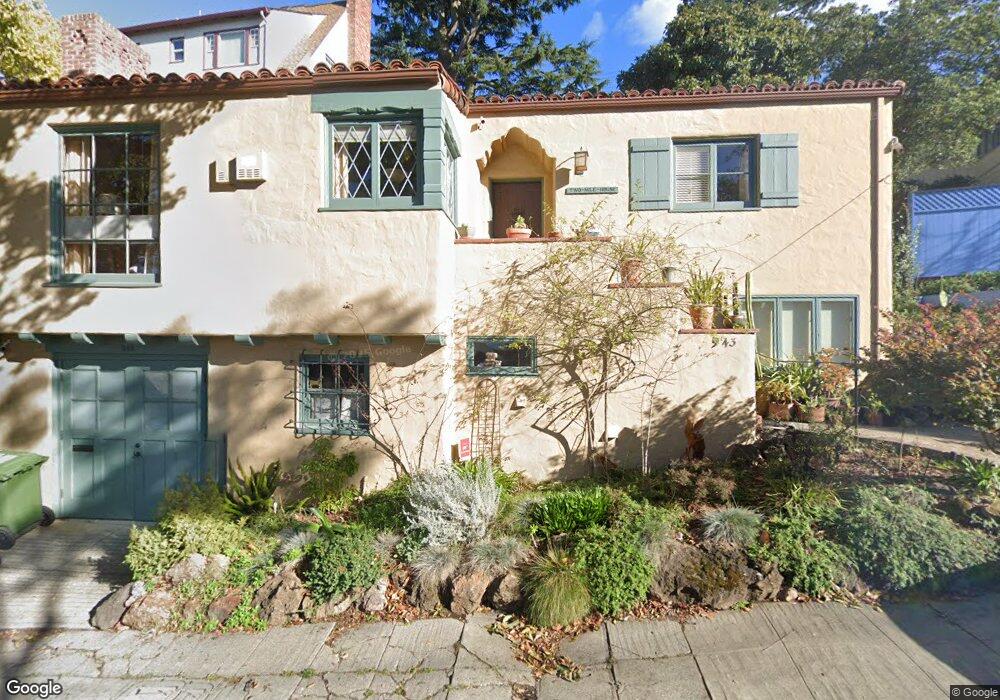
943 Regal Rd Berkeley, CA 94708
Berkeley Hills NeighborhoodEstimated Value: $792,171 - $1,313,000
1
Bed
1
Bath
1,027
Sq Ft
$1,038/Sq Ft
Est. Value
About This Home
This home is located at 943 Regal Rd, Berkeley, CA 94708 and is currently estimated at $1,066,293, approximately $1,038 per square foot. 943 Regal Rd is a home located in Alameda County with nearby schools including Cragmont Elementary School, Berkeley Arts Magnet at Whittier School, and Washington Elementary School.
Ownership History
Date
Name
Owned For
Owner Type
Purchase Details
Closed on
Apr 21, 2015
Sold by
Jordan Joel
Bought by
Shuster Rita M
Current Estimated Value
Home Financials for this Owner
Home Financials are based on the most recent Mortgage that was taken out on this home.
Original Mortgage
$309,000
Interest Rate
3.8%
Mortgage Type
New Conventional
Create a Home Valuation Report for This Property
The Home Valuation Report is an in-depth analysis detailing your home's value as well as a comparison with similar homes in the area
Home Values in the Area
Average Home Value in this Area
Purchase History
| Date | Buyer | Sale Price | Title Company |
|---|---|---|---|
| Shuster Rita M | -- | First American Title Company | |
| Shuster Rita M | -- | First American Title Company |
Source: Public Records
Mortgage History
| Date | Status | Borrower | Loan Amount |
|---|---|---|---|
| Closed | Shuster Rita M | $309,000 |
Source: Public Records
Tax History
| Year | Tax Paid | Tax Assessment Tax Assessment Total Assessment is a certain percentage of the fair market value that is determined by local assessors to be the total taxable value of land and additions on the property. | Land | Improvement |
|---|---|---|---|---|
| 2025 | $3,299 | $86,167 | $65,217 | $27,950 |
| 2024 | $3,299 | $84,340 | $63,938 | $27,402 |
| 2023 | $3,207 | $89,550 | $62,685 | $26,865 |
| 2022 | $3,101 | $80,794 | $61,456 | $26,338 |
| 2021 | $3,074 | $79,073 | $60,251 | $25,822 |
| 2020 | $2,806 | $85,190 | $59,633 | $25,557 |
| 2019 | $2,580 | $83,520 | $58,464 | $25,056 |
| 2018 | $2,507 | $81,883 | $57,318 | $24,565 |
| 2017 | $2,390 | $80,277 | $56,194 | $24,083 |
| 2016 | $2,229 | $78,703 | $55,092 | $23,611 |
| 2015 | $2,186 | $77,521 | $54,265 | $23,256 |
| 2014 | $2,140 | $76,003 | $53,202 | $22,801 |
Source: Public Records
Map
Nearby Homes
- 962 Regal Rd
- 1024 Miller Ave
- 982 Grizzly Peak Blvd
- 1024 Grizzly Peak Blvd
- 1106 Cragmont Ave
- 890 Keeler Ave
- 935 Grizzly Peak Blvd
- 1100 Miller Ave
- 1110 Sterling Ave
- 1165 Cragmont Ave
- 1119 Miller Ave
- 1155 Keeler Ave
- 1040 Park Hills Rd
- 826 Indian Rock Ave
- 758 Spruce St
- 731 Grizzly Peak Blvd
- 1179 Keith Ave
- 1160 Miller Ave
- 20 Stevenson Ave
- 2315 Eunice St
Your Personal Tour Guide
Ask me questions while you tour the home.