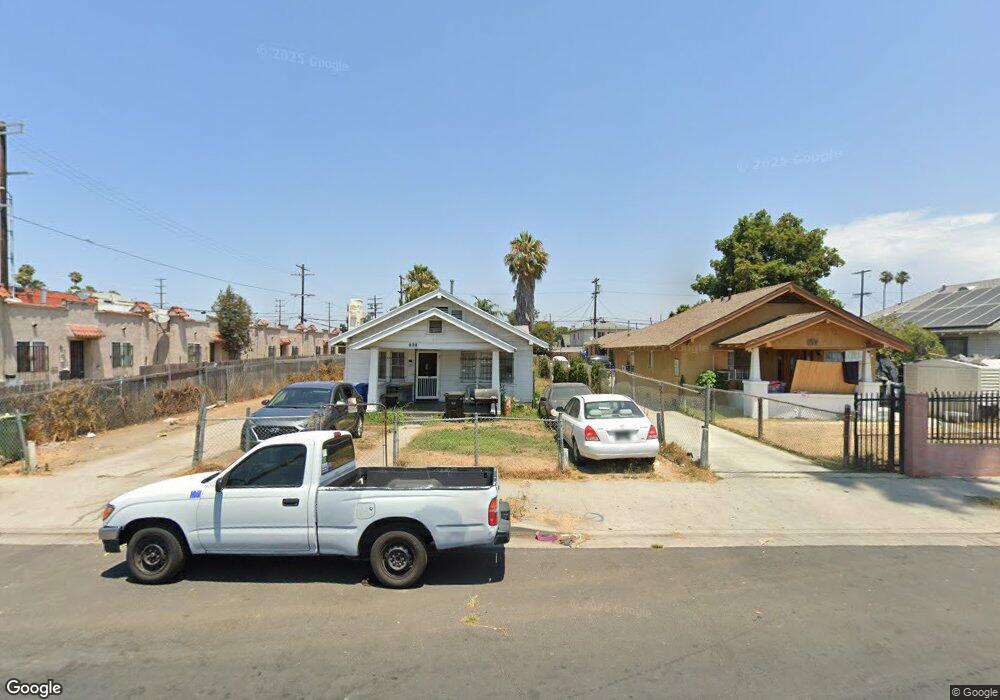
943 W 80th St Los Angeles, CA 90044
Vermont Knolls NeighborhoodEstimated Value: $832,000 - $960,000
9
Beds
4
Baths
3,045
Sq Ft
$290/Sq Ft
Est. Value
About This Home
This home is located at 943 W 80th St, Los Angeles, CA 90044 and is currently estimated at $882,000, approximately $289 per square foot. 943 W 80th St is a home located in Los Angeles County with nearby schools including Loren Miller Elementary School, Mary McLeod Bethune Middle School, and Academy For Multiligual Arts And Science At Mervyn M. Dymally High.
Ownership History
Date
Name
Owned For
Owner Type
Purchase Details
Closed on
Jun 18, 2004
Sold by
Hall Horace F and Hall Susan S
Bought by
Hall Horace F and Hall Susan S
Current Estimated Value
Home Financials for this Owner
Home Financials are based on the most recent Mortgage that was taken out on this home.
Original Mortgage
$248,500
Interest Rate
6.27%
Mortgage Type
New Conventional
Create a Home Valuation Report for This Property
The Home Valuation Report is an in-depth analysis detailing your home's value as well as a comparison with similar homes in the area
Home Values in the Area
Average Home Value in this Area
Purchase History
| Date | Buyer | Sale Price | Title Company |
|---|---|---|---|
| Hall Horace F | -- | North American Title Co |
Source: Public Records
Mortgage History
| Date | Status | Borrower | Loan Amount |
|---|---|---|---|
| Closed | Hall Horace F | $248,500 |
Source: Public Records
Tax History Compared to Growth
Tax History
| Year | Tax Paid | Tax Assessment Tax Assessment Total Assessment is a certain percentage of the fair market value that is determined by local assessors to be the total taxable value of land and additions on the property. | Land | Improvement |
|---|---|---|---|---|
| 2025 | $4,612 | $340,342 | $174,506 | $165,836 |
| 2024 | $4,612 | $333,670 | $171,085 | $162,585 |
| 2023 | $4,536 | $327,129 | $167,731 | $159,398 |
| 2022 | $4,348 | $320,716 | $164,443 | $156,273 |
| 2021 | $4,279 | $314,428 | $161,219 | $153,209 |
| 2020 | $4,315 | $311,205 | $159,566 | $151,639 |
| 2019 | $4,163 | $305,104 | $156,438 | $148,666 |
| 2018 | $4,023 | $299,122 | $153,371 | $145,751 |
| 2016 | $3,826 | $287,509 | $147,416 | $140,093 |
| 2015 | $3,775 | $283,191 | $145,202 | $137,989 |
| 2014 | $3,817 | $277,644 | $142,358 | $135,286 |
Source: Public Records
Map
Nearby Homes