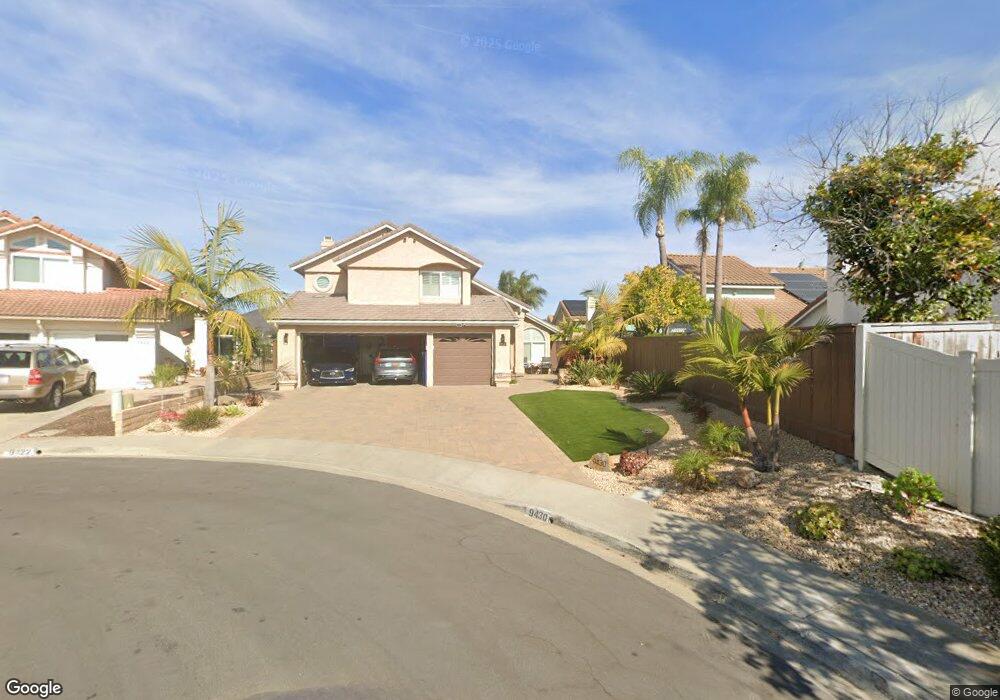
9430 Keck Ct San Diego, CA 92129
Rancho Peñasquitos NeighborhoodEstimated Value: $1,457,085 - $1,724,000
4
Beds
3
Baths
2,137
Sq Ft
$746/Sq Ft
Est. Value
About This Home
This home is located at 9430 Keck Ct, San Diego, CA 92129 and is currently estimated at $1,594,271, approximately $746 per square foot. 9430 Keck Ct is a home located in San Diego County with nearby schools including Canyon View Elementary School, Mesa Verde Middle School, and Westview High School.
Ownership History
Date
Name
Owned For
Owner Type
Purchase Details
Closed on
May 16, 2014
Sold by
Sweeney James E and Sweeney Christine A
Bought by
The Sweeney Family Trust
Current Estimated Value
Purchase Details
Closed on
Feb 13, 2003
Sold by
Sweeney James E and Sweeney Christine A
Bought by
Sweeney James E and Sweeney Christine A
Home Financials for this Owner
Home Financials are based on the most recent Mortgage that was taken out on this home.
Original Mortgage
$130,000
Outstanding Balance
$55,432
Interest Rate
5.89%
Mortgage Type
Credit Line Revolving
Estimated Equity
$1,538,839
Purchase Details
Closed on
Dec 12, 2002
Sold by
Sweeney James E and Sweeney Christine A
Bought by
Sweeney James A and Sweeney Christine A
Home Financials for this Owner
Home Financials are based on the most recent Mortgage that was taken out on this home.
Original Mortgage
$155,000
Interest Rate
6.03%
Purchase Details
Closed on
Feb 9, 2002
Sold by
Sweeney James E and Sweeney Christine A
Bought by
Sweeney James E and Sweeney Christine A
Purchase Details
Closed on
Jun 18, 1987
Create a Home Valuation Report for This Property
The Home Valuation Report is an in-depth analysis detailing your home's value as well as a comparison with similar homes in the area
Home Values in the Area
Average Home Value in this Area
Purchase History
| Date | Buyer | Sale Price | Title Company |
|---|---|---|---|
| The Sweeney Family Trust | -- | None Available | |
| Sweeney James E | -- | Stewart Title | |
| Sweeney James A | -- | Stewart Title | |
| Sweeney James E | -- | -- | |
| -- | $175,000 | -- |
Source: Public Records
Mortgage History
| Date | Status | Borrower | Loan Amount |
|---|---|---|---|
| Open | Sweeney James E | $130,000 | |
| Closed | Sweeney James A | $155,000 |
Source: Public Records
Tax History Compared to Growth
Tax History
| Year | Tax Paid | Tax Assessment Tax Assessment Total Assessment is a certain percentage of the fair market value that is determined by local assessors to be the total taxable value of land and additions on the property. | Land | Improvement |
|---|---|---|---|---|
| 2025 | $3,848 | $349,689 | $94,669 | $255,020 |
| 2024 | $3,848 | $342,833 | $92,813 | $250,020 |
| 2023 | $3,765 | $336,112 | $90,994 | $245,118 |
| 2022 | $3,701 | $329,522 | $89,210 | $240,312 |
| 2021 | $3,652 | $323,061 | $87,461 | $235,600 |
| 2020 | $3,601 | $319,750 | $86,565 | $233,185 |
| 2019 | $3,503 | $313,481 | $84,868 | $228,613 |
| 2018 | $3,400 | $307,335 | $83,204 | $224,131 |
| 2017 | $3,305 | $301,310 | $81,573 | $219,737 |
| 2016 | $3,236 | $295,403 | $79,974 | $215,429 |
| 2015 | $3,184 | $290,967 | $78,773 | $212,194 |
| 2014 | $3,124 | $285,268 | $77,230 | $208,038 |
Source: Public Records
Map
Nearby Homes
- 12727 Calle de Las Rosas
- 9525 Vervain St
- 9562 Benavente St
- 13202 Salmon River Rd Unit 101
- 9720 Graceland Way
- 9342 Twin Trails Dr Unit 303
- 9432 Hito Ct
- 13292 Salmon River Rd Unit 204
- 9302 Twin Trails Dr Unit 204
- 12940 Calle de Las Rosas
- 9525 High Park Ln
- 9068 Buckwheat St
- 12979 Calle de Las Rosas
- 9378 Chabola Rd
- 12661 Cijon St
- 9012 Buckwheat St
- 9488 Hiker Hill Rd
- 9819 Kika Ct
- 13113 Calle de Las Rosas
- 13411 Appalachian Way
- 9422 Keck Ct
- 12666 Kestrel St
- 12672 Kestrel St
- 12660 Kestrel St
- 12680 Kestrel St
- 9414 Keck Ct
- 12654 Kestrel St
- 12686 Kestrel St
- 9423 Keck Ct
- 9431 Keck Ct
- 12692 Kestrel St
- 9415 Keck Ct
- 12665 Kestrel St
- 12671 Kestrel St
- 9439 Keck Ct
- 12659 Kestrel St
- 12677 Kestrel St
- 12698 Kestrel St
- 12685 Kestrel St
- 12651 Kestrel St