9434 W Pierson St Phoenix, AZ 85037
Estimated payment $2,454/month
Highlights
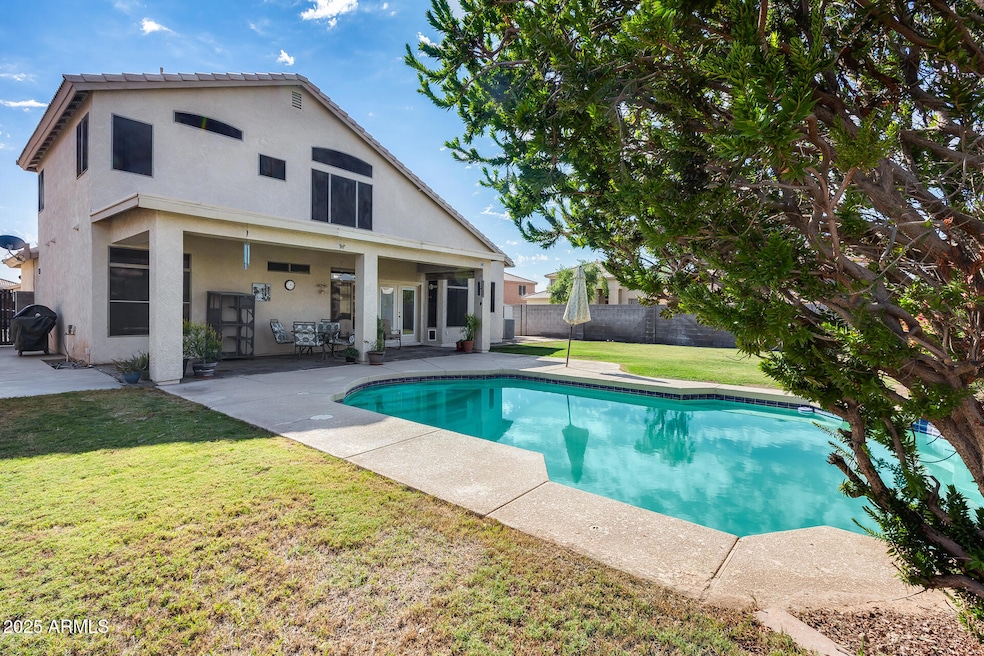
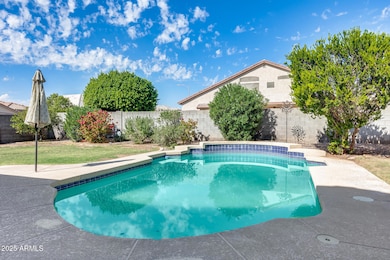
- Private Pool
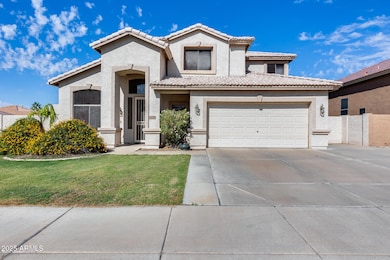
- Corner Lot
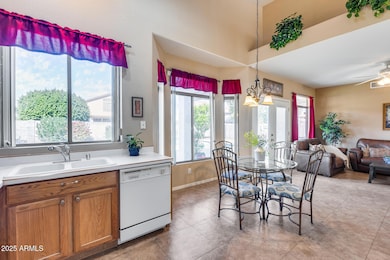
- Eat-In Kitchen
- Vaulted Ceiling
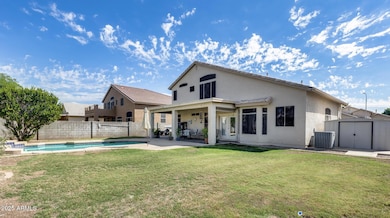
- Covered Patio or Porch
- 1-minute walk to Tierra Rosa Community Park
About This Home
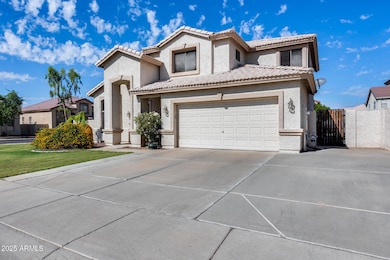
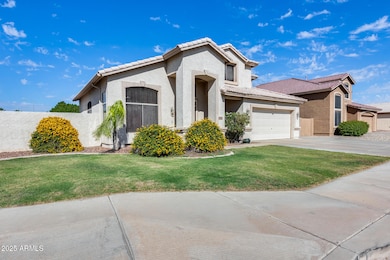
Great Opportunity in Terracita! This two-story home offers an incredible value — priced well below neighborhood comps! Perfectly situated on a spacious corner lot (7,745 sq ft), you'll love the sparkling play pool, lush real grass surrounded by citrus trees, and low-maintenance landscaping. A storage shed conveys with the sale, and the extended covered patio is ideal for entertaining. The driveway fits up to 3 cars, providing ample parking space. Inside, the kitchen overlooks the backyard and opens to the living area with charming decorative built-ins. A bedroom and full bath downstairs make for a perfect guest setup, along with a convenient laundry room. Upstairs, you'll find two guest bedrooms, a full bath, and a spacious primary suite featuring a 2023-updated walk-in shower, dual-sink vanity, garden tub, and a large walk-in closet. All of this in a fantastic location just minutes from State Farm Stadium, Westgate Entertainment District, shopping, dining, and freeway access. Don't miss this onehomes like this in Terracita don't come along often!
Home Details
Home Type
- Single Family
Est. Annual Taxes
- $1,870
Year Built
- Built in 1999
Lot Details
- 7,745 Sq Ft Lot
- Block Wall Fence
- Corner Lot
- Grass Covered Lot
HOA Fees
- $58 Monthly HOA Fees
Parking
- 3 Open Parking Spaces
- 2 Car Garage
Home Design
- Wood Frame Construction
- Tile Roof
- Stucco
Interior Spaces
- 1,907 Sq Ft Home
- 1-Story Property
- Vaulted Ceiling
- Ceiling Fan
- Double Pane Windows
- Laundry Room
Kitchen
- Eat-In Kitchen
- Built-In Microwave
- Laminate Countertops
Flooring
- Carpet
- Tile
Bedrooms and Bathrooms
- 4 Bedrooms
- Bathroom Updated in 2023
- Primary Bathroom is a Full Bathroom
- 3 Bathrooms
- Dual Vanity Sinks in Primary Bathroom
- Soaking Tub
- Bathtub With Separate Shower Stall
Pool
- Private Pool
- Diving Board
Outdoor Features
- Covered Patio or Porch
Schools
- Pendergast Elementary School
- Tolleson Union High School
Utilities
- Central Air
- Heating unit installed on the ceiling
- High Speed Internet
- Cable TV Available
Listing and Financial Details
- Tax Lot 70
- Assessor Parcel Number 102-18-112
Community Details
Overview
- Association fees include ground maintenance
- Terracita Association, Phone Number (623) 877-1396
- Terracita Subdivision
Recreation
- Community Playground
- Bike Trail
Map
Home Values in the Area
Average Home Value in this Area
Tax History
| Year | Tax Paid | Tax Assessment Tax Assessment Total Assessment is a certain percentage of the fair market value that is determined by local assessors to be the total taxable value of land and additions on the property. | Land | Improvement |
|---|---|---|---|---|
| 2025 | $2,103 | $14,393 | -- | -- |
| 2024 | $1,904 | $13,707 | -- | -- |
| 2023 | $1,904 | $28,580 | $5,710 | $22,870 |
| 2022 | $1,827 | $23,760 | $4,750 | $19,010 |
| 2021 | $1,756 | $21,500 | $4,300 | $17,200 |
| 2020 | $1,704 | $20,180 | $4,030 | $16,150 |
| 2019 | $1,691 | $18,160 | $3,630 | $14,530 |
| 2018 | $1,587 | $16,930 | $3,380 | $13,550 |
| 2017 | $1,480 | $15,650 | $3,130 | $12,520 |
| 2016 | $1,355 | $14,020 | $2,800 | $11,220 |
| 2015 | $1,318 | $14,580 | $2,910 | $11,670 |
Property History
| Date | Event | Price | List to Sale | Price per Sq Ft |
|---|---|---|---|---|
| 10/24/2025 10/24/25 | For Sale | $425,000 | -- | $223 / Sq Ft |
Purchase History
| Date | Type | Sale Price | Title Company |
|---|---|---|---|
| Interfamily Deed Transfer | -- | None Available | |
| Warranty Deed | $169,000 | Security Title Agency | |
| Warranty Deed | $149,750 | Equity Title Agency | |
| Warranty Deed | -- | Equity Title Agency |
Mortgage History
| Date | Status | Loan Amount | Loan Type |
|---|---|---|---|
| Open | $173,475 | New Conventional | |
| Previous Owner | $142,262 | New Conventional |
Source: Arizona Regional Multiple Listing Service (ARMLS)
MLS Number: 6938109
APN: 102-18-112
Disclaimer: Certain information contained herein is derived from information provided by parties other than Homes.com. All information provided is deemed reliable, but is not guaranteed to be accurate and should be independently verified.
![]() All information should be verified by the recipient and none is guaranteed as accurate by ARMLS
All information should be verified by the recipient and none is guaranteed as accurate by ARMLS
Listing Information presented by local MLS brokerage: Ten-X, local REALTOR®- Arlene Richardson - (888)-952-6393
- 4831 N 93rd Dr
- 4714 N 95th Dr
- 9510 W Hazelwood St
- 4718 N 92nd Ave
- 4708 N 96th Ln
- 9309 W Orange Dr
- 4632 N 91st Ln
- 4518 N 92nd Ln
- 9340 W Oregon Ave
- 9329 W Sells Dr
- 9302 W Georgia Ave
- 9025 W Elm St Unit 2
- 9023 W Elm St Unit 8
- 9019 W Elm St Unit 5
- 9021 W Elm St Unit 1
- 9138 W Sells Dr
- 9015 W Elm St Unit 8
- 9015 W Elm St Unit 2
- 9349 W Montecito Ave
- 9009 W Orange Dr
- 5151 N 95th Ave
- 4815 N 96th Ln Unit 2
- 9506 W Hazelwood St
- 9419 W Willow Bend Ln
- 4439 N 94th Dr
- 9329 W Sells Dr
- 4747 N 99th Ave
- 9029 W Elm St Unit 8
- 9135 W Minnezona Ave
- 9600 W Georgia Ave
- 9020 W Highland Ave Unit 36
- 4708 N 89th Dr
- 4651 N 99th Dr
- 5550 N 95th Ave
- 4352 N 91st Glen
- 4643 N 99th Dr
- 5150 N 99th Ave
- 4820 N 89th Ave Unit 91
- 4411 N 99th Ave
- 4628 N Guadal Dr
