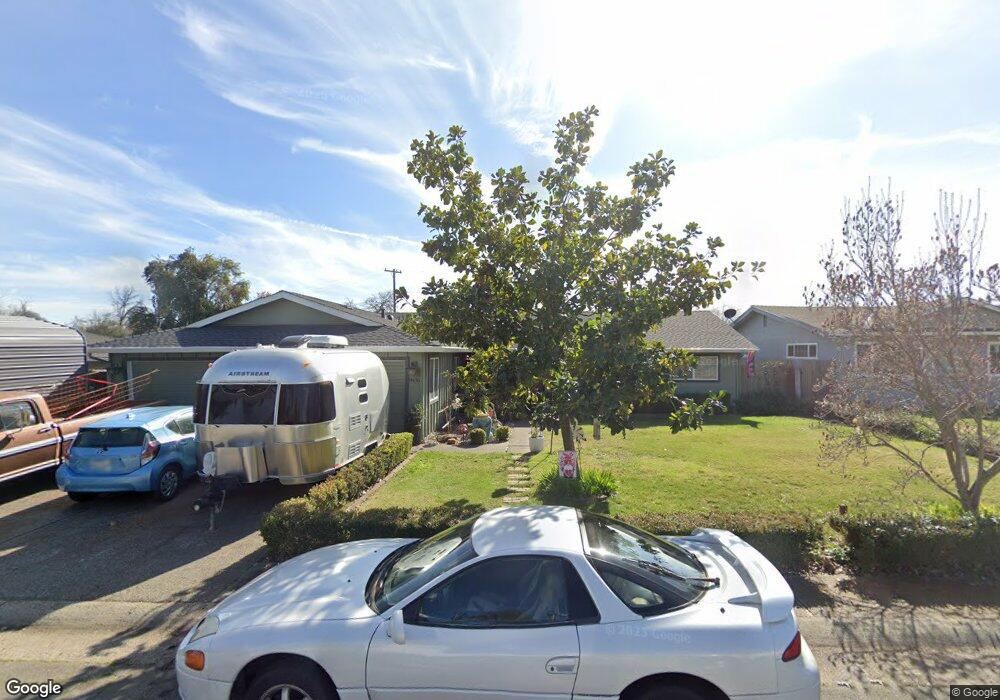
9436 Drift Way Orangevale, CA 95662
Estimated Value: $392,000 - $632,000
3
Beds
2
Baths
1,556
Sq Ft
$348/Sq Ft
Est. Value
About This Home
This home is located at 9436 Drift Way, Orangevale, CA 95662 and is currently estimated at $540,744, approximately $347 per square foot. 9436 Drift Way is a home located in Sacramento County with nearby schools including Twin Lakes Elementary School, Andrew Carnegie Middle School, and Bella Vista High School.
Ownership History
Date
Name
Owned For
Owner Type
Purchase Details
Closed on
Nov 6, 2017
Sold by
Horton Jay Scott
Bought by
Horton Nickie
Current Estimated Value
Purchase Details
Closed on
Nov 27, 2002
Sold by
Horton Nickie G
Bought by
Horton Jay Scott
Home Financials for this Owner
Home Financials are based on the most recent Mortgage that was taken out on this home.
Original Mortgage
$211,000
Interest Rate
6.28%
Purchase Details
Closed on
Feb 20, 2002
Sold by
Horton Jay Scott
Bought by
Horton Jay Scott and Horton Nickie G
Home Financials for this Owner
Home Financials are based on the most recent Mortgage that was taken out on this home.
Original Mortgage
$170,000
Interest Rate
6.99%
Purchase Details
Closed on
Oct 9, 2001
Sold by
Horton Jay Scott and Teddy Lee Horton Trust
Bought by
Horton Jay Scott
Purchase Details
Closed on
Oct 20, 1994
Sold by
Horton Teddy L
Bought by
Horton Teddy L and Teddy Lee Horton Trust
Create a Home Valuation Report for This Property
The Home Valuation Report is an in-depth analysis detailing your home's value as well as a comparison with similar homes in the area
Home Values in the Area
Average Home Value in this Area
Purchase History
| Date | Buyer | Sale Price | Title Company |
|---|---|---|---|
| Horton Nickie | -- | Orange Coast Title | |
| Horton Jay Scott | -- | Old Republic Title Company | |
| Horton Jay Scott | -- | Orange Coast Title | |
| Horton Jay Scott | -- | Orange Coast Title | |
| Horton Jay Scott | -- | -- | |
| Horton Jay Scott | -- | -- | |
| Horton Teddy L | -- | -- |
Source: Public Records
Mortgage History
| Date | Status | Borrower | Loan Amount |
|---|---|---|---|
| Closed | Horton Jay Scott | $211,000 | |
| Closed | Horton Jay Scott | $170,000 |
Source: Public Records
Tax History Compared to Growth
Tax History
| Year | Tax Paid | Tax Assessment Tax Assessment Total Assessment is a certain percentage of the fair market value that is determined by local assessors to be the total taxable value of land and additions on the property. | Land | Improvement |
|---|---|---|---|---|
| 2025 | $2,198 | $189,358 | $54,403 | $134,955 |
| 2024 | $2,198 | $185,646 | $53,337 | $132,309 |
| 2023 | $2,142 | $182,007 | $52,292 | $129,715 |
| 2022 | $2,130 | $178,439 | $51,267 | $127,172 |
| 2021 | $2,093 | $174,941 | $50,262 | $124,679 |
| 2020 | $2,054 | $173,148 | $49,747 | $123,401 |
| 2019 | $2,012 | $169,754 | $48,772 | $120,982 |
| 2018 | $1,988 | $166,426 | $47,816 | $118,610 |
| 2017 | $1,968 | $163,164 | $46,879 | $116,285 |
| 2016 | $3,155 | $159,965 | $45,960 | $114,005 |
| 2015 | $3,088 | $157,563 | $45,270 | $112,293 |
| 2014 | $3,350 | $154,478 | $44,384 | $110,094 |
Source: Public Records
Map
Nearby Homes
- 9514 Bullion Way
- 9391 Rolling Glen Ct
- 9412 Twin Lakes Ave
- 9429 Erwin Ave
- 5168 Mississippi Bar Dr
- 5601 Walnut Ave Unit 4
- 5607 Walnut Ave Unit 10
- 5601 Spindrift Ln
- 5312 Tall Oak Ln
- 9160 Madison Ave Unit 57
- 9160 Madison Ave Unit 44
- 9487 Dalton Way
- 9709 Snowberry Way
- 9260 Castlemont Cir
- 9196 Rolling Tree Ln
- 9237 Madison Ave
- 9215 Madison Ave
- 5943 Main Ave Unit D
- 5947 Main Ave Unit A
- 9172 Madison Green Ln Unit 49
- 9430 Drift Way
- 9444 Drift Way
- 5319 Dredger Way
- 9424 Drift Way
- 9435 Buffalo Ave
- 9441 Buffalo Ave
- 9445 Drift Way
- 9437 Drift Way
- 9429 Buffalo Ave
- 9431 Drift Way
- 5311 Dredger Way
- 9449 Buffalo Ave
- 9418 Drift Way
- 9423 Drift Way
- 9423 Buffalo Ave
- 5409 Dredger Way
- 9419 Drift Way
- 5301 Dredger Way
- 9412 Drift Way
- 5324 Dredger Way