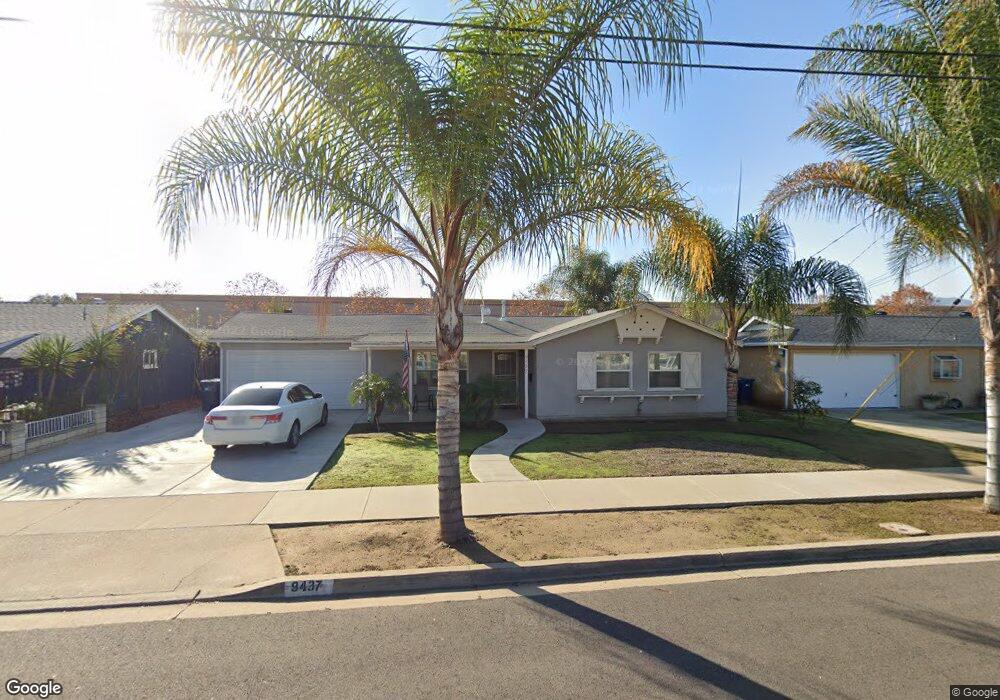
9437 Willowgrove Ave Santee, CA 92071
Carlton Hills NeighborhoodEstimated Value: $791,558 - $821,000
3
Beds
2
Baths
1,326
Sq Ft
$612/Sq Ft
Est. Value
About This Home
This home is located at 9437 Willowgrove Ave, Santee, CA 92071 and is currently estimated at $810,890, approximately $611 per square foot. 9437 Willowgrove Ave is a home located in San Diego County with nearby schools including Carlton Hills Elementary School and West Hills High School.
Ownership History
Date
Name
Owned For
Owner Type
Purchase Details
Closed on
Jun 29, 2012
Sold by
Polymathic Properties Inc
Bought by
Torres Julia P and Torres Fernando
Current Estimated Value
Home Financials for this Owner
Home Financials are based on the most recent Mortgage that was taken out on this home.
Original Mortgage
$320,000
Outstanding Balance
$220,833
Interest Rate
3.74%
Mortgage Type
VA
Estimated Equity
$590,057
Purchase Details
Closed on
Dec 30, 2011
Sold by
Wheeler Daniel and Wheeler Diane
Bought by
Polymathic Properties Inc
Purchase Details
Closed on
Jul 5, 2000
Sold by
Trust 05-06-97 Wheeler Jerald D & Roschelle F and Wheeler Roschelle
Bought by
Wheeler Daniel and Wheeler Diane
Home Financials for this Owner
Home Financials are based on the most recent Mortgage that was taken out on this home.
Original Mortgage
$160,680
Interest Rate
8.19%
Mortgage Type
VA
Purchase Details
Closed on
May 6, 1997
Sold by
Wheeler Jerald D
Bought by
Wheeler Jerald D and Wheeler Roschelle
Create a Home Valuation Report for This Property
The Home Valuation Report is an in-depth analysis detailing your home's value as well as a comparison with similar homes in the area
Home Values in the Area
Average Home Value in this Area
Purchase History
| Date | Buyer | Sale Price | Title Company |
|---|---|---|---|
| Torres Julia P | $320,000 | None Available | |
| Polymathic Properties Inc | $215,000 | None Available | |
| Wheeler Daniel | -- | Commonwealth Land Title Co | |
| Wheeler Jerald D | -- | -- |
Source: Public Records
Mortgage History
| Date | Status | Borrower | Loan Amount |
|---|---|---|---|
| Open | Torres Julia P | $320,000 | |
| Previous Owner | Wheeler Daniel | $160,680 |
Source: Public Records
Tax History
| Year | Tax Paid | Tax Assessment Tax Assessment Total Assessment is a certain percentage of the fair market value that is determined by local assessors to be the total taxable value of land and additions on the property. | Land | Improvement |
|---|---|---|---|---|
| 2025 | $2,721 | $394,047 | $147,765 | $246,282 |
| 2024 | $2,721 | $386,321 | $144,868 | $241,453 |
| 2023 | $2,701 | $378,747 | $142,028 | $236,719 |
| 2022 | $4,549 | $371,322 | $139,244 | $232,078 |
| 2021 | $4,487 | $364,042 | $136,514 | $227,528 |
| 2020 | $4,432 | $360,310 | $135,115 | $225,195 |
| 2019 | $4,277 | $353,246 | $132,466 | $220,780 |
| 2018 | $4,190 | $346,320 | $129,869 | $216,451 |
| 2017 | $4,136 | $339,530 | $127,323 | $212,207 |
| 2016 | $4,011 | $332,874 | $124,827 | $208,047 |
| 2015 | $3,958 | $327,874 | $122,952 | $204,922 |
| 2014 | $3,878 | $321,452 | $120,544 | $200,908 |
Source: Public Records
Map
Nearby Homes
- 9459 Mission Gorge Rd Unit 121
- 9401 Carlton Oaks Dr Unit E
- 9219 Via de Amor
- 9428 Prospect Ave
- 8653 Willow Terrace
- 0000 Prospect Ave
- 0 River Park Dr Unit na
- 405 Whispering Willow Dr Unit E
- 8772 Glen Vista Way
- 9857 Mission Gorge Rd Unit 4
- 9409 Pike Rd
- 9410 Pike Rd
- 8837 Mission Greens Rd Unit 1
- 9855 Mission Greens Ct Unit 3
- 9855 Mission Greens Ct Unit 4
- 9860 Buena Vista Ave Unit 3
- 9462 Doheny Rd
- 305 Cricket Ct
- 313 Brookside Way
- 317 Brookside Way
- 9443 Willowgrove Ave
- 9431 Willowgrove Ave
- 9449 Willowgrove Ave
- 9423 Willowgrove Ave
- 9015 Willowgrove Cir
- 9455 Willowgrove Ave
- 9417 Willowgrove Ave
- 9010 Willowgrove Place
- 9016 Willowgrove Cir
- 9027 Willowgrove Cir
- 9409 Willowgrove Ave
- 9022 Willowgrove Place
- 9507 Willowgrove Ave
- 9028 Willowgrove Cir
- 9017 Willowgrove Ct
- 9403 Willowgrove Ave
- 9011 Willowgrove Place
- 9036 Willowgrove Place
- 9039 Willowgrove Cir
- 9029 Willowgrove Ct
Your Personal Tour Guide
Ask me questions while you tour the home.