9439 Sunset Blvd Beverly Hills, CA 90210
Estimated Value: $7,275,000 - $33,541,646
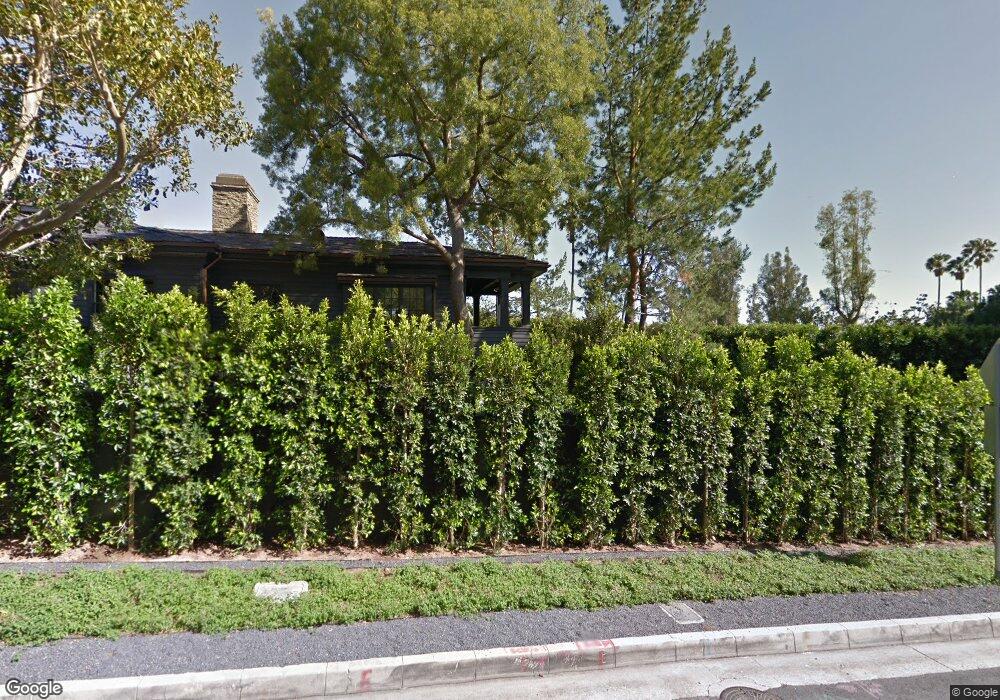
About This Home
This home is located at 9439 Sunset Blvd, Beverly Hills, CA 90210 and is currently estimated at $20,408,323, approximately $2,961 per square foot. 9439 Sunset Blvd is a home located in Los Angeles County with nearby schools including Hawthorne Elementary School, Beverly Hills High School, and Good Shepherd Catholic School.
Ownership History
We collect this data history from publicly available records. To have your information removed, we recommend requesting removal directly through your county’s website.
Purchase Details
Purchase Details
Purchase Details
Home Financials for this Owner
Home Financials are based on the most recent Mortgage that was taken out on this home.Purchase Details
Purchase Details
Home Values in the Area
Average Home Value in this Area
Purchase History
We collect this data history from publicly available records. To have your information removed, we recommend requesting removal directly through your county’s website.
| Date | Buyer | Sale Price | Title Company |
|---|---|---|---|
| $12,800,128 | Ticor Title Company | ||
| -- | None Available | ||
| -- | -- | ||
| -- | Fidelity Title | ||
| -- | -- | ||
| -- | -- |
Mortgage History
We collect this data history from publicly available records. To have your information removed, we recommend requesting removal directly through your county’s website.
| Date | Status | Borrower | Loan Amount |
|---|---|---|---|
| Previous Owner | $1,800,000 |
Tax History
We collect this data history from publicly available records. To have your information removed, we recommend requesting removal directly through your county’s website.
| Year | Tax Paid | Tax Assessment Tax Assessment Total Assessment is a certain percentage of the fair market value that is determined by local assessors to be the total taxable value of land and additions on the property. | Land | Improvement |
|---|---|---|---|---|
| 2025 | $263,485 | $21,874,889 | $15,072,684 | $6,802,205 |
| 2024 | $258,235 | $21,445,971 | $14,777,142 | $6,668,829 |
| 2023 | $253,545 | $21,025,463 | $14,487,395 | $6,538,068 |
| 2022 | $246,264 | $20,613,200 | $14,203,329 | $6,409,871 |
| 2021 | $239,171 | $20,209,021 | $13,924,833 | $6,284,188 |
| 2020 | $238,388 | $20,001,803 | $13,782,051 | $6,219,752 |
| 2019 | $232,263 | $19,609,612 | $13,511,815 | $6,097,797 |
| 2018 | $223,200 | $19,225,111 | $13,246,878 | $5,978,233 |
| 2016 | $157,708 | $13,581,318 | $12,732,487 | $848,831 |
| 2015 | $150,942 | $13,377,315 | $12,541,234 | $836,081 |
| 2014 | $145,851 | $13,115,273 | $12,295,569 | $819,704 |
Map
- 602 Mountain Dr
- 520 Stonewood Dr
- 510 Stonewood Dr
- 816 Monte Leon Dr
- 402 Doheny Rd
- 701 N Arden Dr
- 1120 El Retiro Way
- 1115 La Altura Rd
- 1114 Calle Vista Dr
- 1118 Calle Vista Dr
- 409 Drury Ln
- 1116 Calle Vista Dr
- 9255 Doheny Rd Unit 703
- 9255 Doheny Rd Unit PH
- 9255 Doheny Rd Unit 1204
- 1124 Sierra Alta Way
- 1130 Sierra Alta Way
- 1135 Sunset Vale Ave
- 909 N Alpine Dr
- 1211 Sierra Alta Way
- 585 Mountain Dr
- 820 Loma Vista Dr
- 9431 Sunset Blvd
- 9425 Sunset Blvd
- 9451 Sunset Blvd
- 9419 Sunset Blvd
- 830 Loma Vista Dr
- 825 Loma Vista Dr
- 601 Mountain Dr
- 9401 Sunset Blvd
- 9463 Sunset Blvd
- 719 N Palm Dr
- 720 N Palm Dr
- 835 Loma Vista Dr
- 510 Doheny Rd
- 840 Loma Vista Dr
- 514 Doheny Rd
- 718 N Palm Dr
- 605 Mountain Dr
- 726 N Maple Dr
Ask me questions while you tour the home.