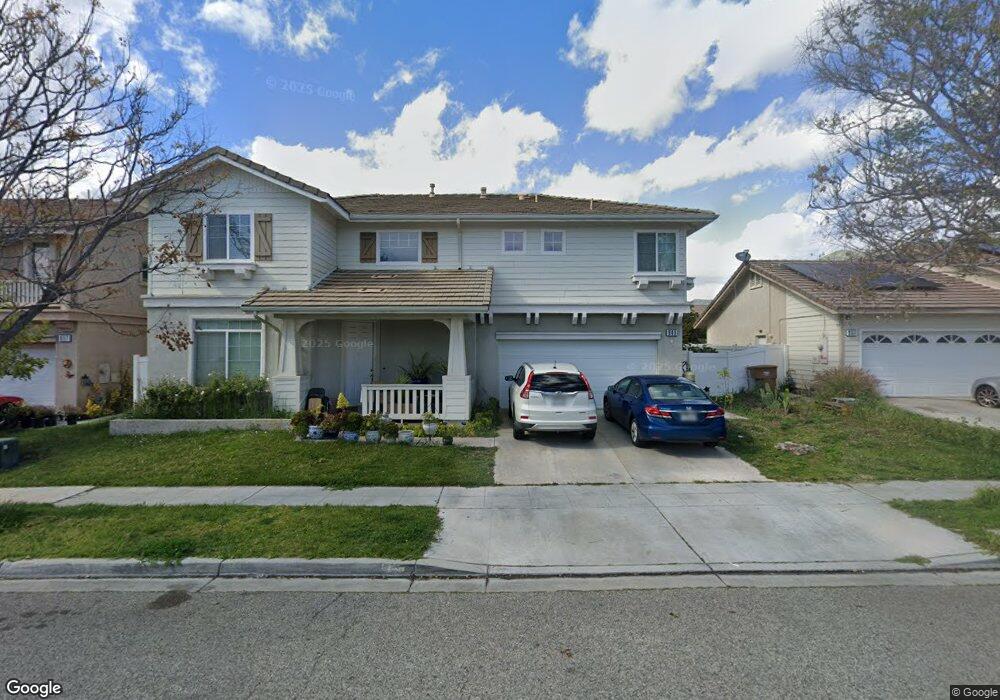
945 5th St Fillmore, CA 93015
Estimated Value: $730,000 - $843,000
4
Beds
3
Baths
2,355
Sq Ft
$340/Sq Ft
Est. Value
About This Home
This home is located at 945 5th St, Fillmore, CA 93015 and is currently estimated at $800,602, approximately $339 per square foot. 945 5th St is a home located in Ventura County with nearby schools including Fillmore Senior High.
Ownership History
Date
Name
Owned For
Owner Type
Purchase Details
Closed on
Oct 15, 2010
Sold by
Cervantes Carlos and Cervantes Adriana
Bought by
Cervantes Javier and Cervantes Guadalupe
Current Estimated Value
Purchase Details
Closed on
Sep 12, 2002
Sold by
The Griffin Homebuilding Group Llc
Bought by
Cervantes Roxana and Cervantes Javier
Home Financials for this Owner
Home Financials are based on the most recent Mortgage that was taken out on this home.
Original Mortgage
$342,000
Outstanding Balance
$142,031
Interest Rate
6.16%
Estimated Equity
$658,571
Create a Home Valuation Report for This Property
The Home Valuation Report is an in-depth analysis detailing your home's value as well as a comparison with similar homes in the area
Home Values in the Area
Average Home Value in this Area
Purchase History
| Date | Buyer | Sale Price | Title Company |
|---|---|---|---|
| Cervantes Javier | -- | None Available | |
| Cervantes Javier | -- | None Available | |
| Cervantes Roxana | $380,000 | First American Title Ins Co |
Source: Public Records
Mortgage History
| Date | Status | Borrower | Loan Amount |
|---|---|---|---|
| Open | Cervantes Roxana | $342,000 |
Source: Public Records
Tax History
| Year | Tax Paid | Tax Assessment Tax Assessment Total Assessment is a certain percentage of the fair market value that is determined by local assessors to be the total taxable value of land and additions on the property. | Land | Improvement |
|---|---|---|---|---|
| 2025 | $6,980 | $534,181 | $219,396 | $314,785 |
| 2024 | $6,980 | $523,707 | $215,094 | $308,613 |
| 2023 | $6,895 | $513,439 | $210,877 | $302,562 |
| 2022 | $6,423 | $503,372 | $206,742 | $296,630 |
| 2021 | $7,101 | $493,502 | $202,688 | $290,814 |
| 2020 | $6,659 | $488,443 | $200,610 | $287,833 |
| 2019 | $6,640 | $478,867 | $196,677 | $282,190 |
| 2018 | $6,501 | $469,478 | $192,821 | $276,657 |
| 2017 | $6,504 | $460,274 | $189,041 | $271,233 |
| 2016 | $6,066 | $451,250 | $185,335 | $265,915 |
| 2015 | $5,911 | $444,474 | $182,552 | $261,922 |
| 2014 | $5,753 | $423,000 | $174,000 | $249,000 |
Source: Public Records
Map
Nearby Homes
- 949 Blaine Ave
- 831 Blaine Ave
- 815 Woodgrove Rd
- 809 Woodgrove Rd
- 600 C St
- 1106 Mockingbird Ln
- 345 Blaine Ave
- 313 C St
- 1262 Sespe Ave
- 1560 Goodenough Rd
- 320 D St
- 404 Central Ave
- 639 Mountain View St
- 1172 Oak Ave
- 340 Central Ave
- 318 Bard St
- 1163 W Ventura St
- 228 Parkhaven Ct
- 616 Island View St
- 578 Apricot Ln
Your Personal Tour Guide
Ask me questions while you tour the home.