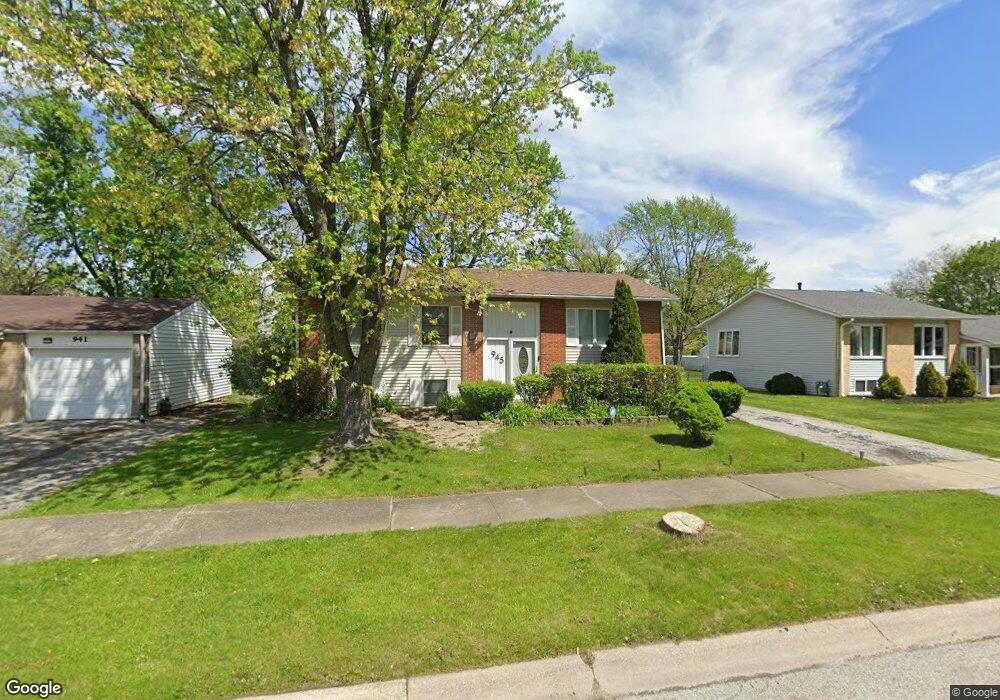
945 Dartmouth Ave Matteson, IL 60443
West Matteson NeighborhoodEstimated Value: $194,000 - $251,000
3
Beds
1
Bath
1,025
Sq Ft
$209/Sq Ft
Est. Value
About This Home
This home is located at 945 Dartmouth Ave, Matteson, IL 60443 and is currently estimated at $213,914, approximately $208 per square foot. 945 Dartmouth Ave is a home located in Cook County with nearby schools including Colin Powell Middle School.
Ownership History
Date
Name
Owned For
Owner Type
Purchase Details
Closed on
Mar 1, 2002
Sold by
The Village Of Hillside
Bought by
Illinois Department Of Transportation
Current Estimated Value
Purchase Details
Closed on
Jan 11, 2002
Sold by
Cartwright Samuel
Bought by
Cartwright Deidre A
Purchase Details
Closed on
Sep 18, 1998
Sold by
Jones Diedre A and Cartwright Deidre A
Bought by
Cartwright Samuel and Cartwright Diedre A
Home Financials for this Owner
Home Financials are based on the most recent Mortgage that was taken out on this home.
Original Mortgage
$105,091
Interest Rate
6.9%
Mortgage Type
FHA
Purchase Details
Closed on
Aug 7, 1995
Sold by
Harnishfeger David J and Harnishfeger Cheryl L
Bought by
Jones Deidre A
Home Financials for this Owner
Home Financials are based on the most recent Mortgage that was taken out on this home.
Original Mortgage
$105,010
Interest Rate
7.51%
Mortgage Type
FHA
Create a Home Valuation Report for This Property
The Home Valuation Report is an in-depth analysis detailing your home's value as well as a comparison with similar homes in the area
Home Values in the Area
Average Home Value in this Area
Purchase History
| Date | Buyer | Sale Price | Title Company |
|---|---|---|---|
| Illinois Department Of Transportation | -- | Chicago Title Insurance Co | |
| Cartwright Deidre A | -- | -- | |
| Cartwright Samuel | -- | Stewart Title Company | |
| Jones Deidre A | $106,000 | -- |
Source: Public Records
Mortgage History
| Date | Status | Borrower | Loan Amount |
|---|---|---|---|
| Previous Owner | Cartwright Samuel | $105,091 | |
| Previous Owner | Jones Deidre A | $105,010 |
Source: Public Records
Tax History Compared to Growth
Tax History
| Year | Tax Paid | Tax Assessment Tax Assessment Total Assessment is a certain percentage of the fair market value that is determined by local assessors to be the total taxable value of land and additions on the property. | Land | Improvement |
|---|---|---|---|---|
| 2024 | $4,844 | $15,000 | $3,016 | $11,984 |
| 2023 | $3,809 | $15,000 | $3,016 | $11,984 |
| 2022 | $3,809 | $10,535 | $2,639 | $7,896 |
| 2021 | $3,894 | $10,535 | $2,639 | $7,896 |
| 2020 | $3,882 | $10,535 | $2,639 | $7,896 |
| 2019 | $4,281 | $11,265 | $2,450 | $8,815 |
| 2018 | $4,216 | $11,265 | $2,450 | $8,815 |
| 2017 | $4,131 | $11,265 | $2,450 | $8,815 |
| 2016 | $4,085 | $10,391 | $2,262 | $8,129 |
| 2015 | $3,947 | $10,391 | $2,262 | $8,129 |
| 2014 | $3,867 | $10,391 | $2,262 | $8,129 |
| 2013 | $4,147 | $11,645 | $2,262 | $9,383 |
Source: Public Records
Map
Nearby Homes
- 953 Dartmouth Ave
- 948 Dartmouth Ave
- 912 Princeton Ave
- 5503 Georgetown Dr
- 997 Regent Dr
- 970 Regent Dr
- 829 Princeton Ave
- 856 Notre Dame Dr
- 5631 Colgate Ln
- 931 Destiny Dr
- 1000 Warwick Dr
- 1008 Willow Rd
- 749 Old Farm Rd
- 6216 Pond View Dr
- 6103 Sunflower Dr
- 6021 Spring Ln
- 322 Central Ave
- 6037 Spring Ln
- 6125 Sunflower Dr
- 5228 Southwick Ct Unit 2
- 947 Dartmouth Ave
- 941 Dartmouth Ave
- 950 Central Ave
- 937 Dartmouth Ave
- 944 Central Ave
- 954 Central Ave
- 946 Dartmouth Ave
- 938 Central Ave
- 942 Dartmouth Ave
- 958 Central Ave
- 957 Dartmouth Ave
- 931 Dartmouth Ave
- 938 Dartmouth Ave
- 954 Dartmouth Ave
- 932 Central Ave
- 932 Dartmouth Ave
- 961 Dartmouth Ave
- 925 Dartmouth Ave
- 958 Dartmouth Ave
- 962 Central Ave