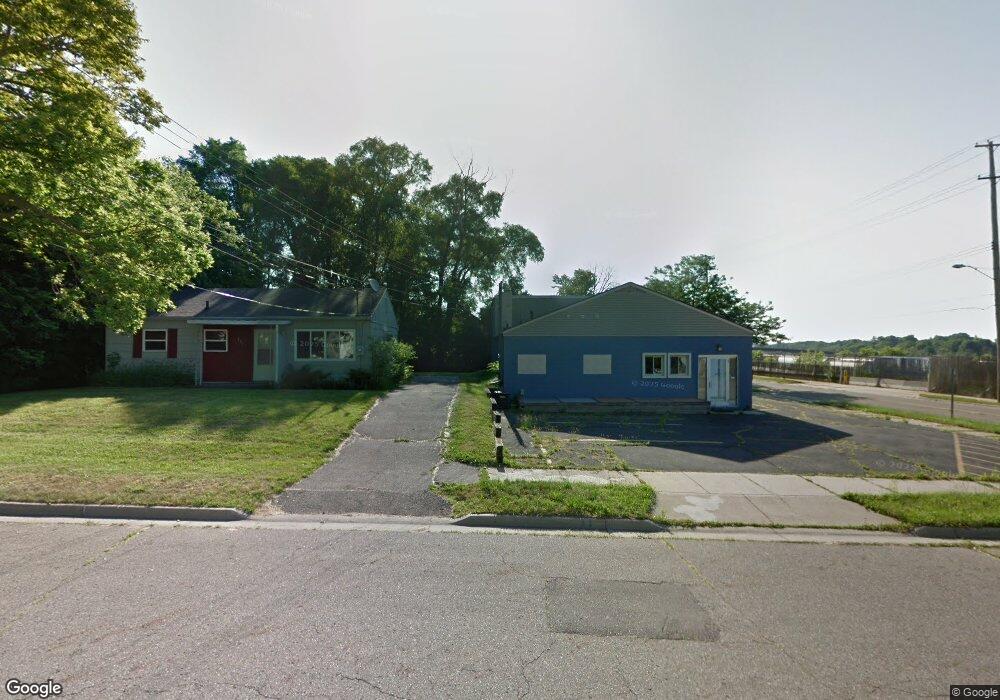
945 W Ller Lansing, MI 48911
Southern Lansing NeighborhoodEstimated Value: $155,000 - $194,000
3
Beds
1
Bath
1,674
Sq Ft
$104/Sq Ft
Est. Value
About This Home
This home is located at 945 W Ller, Lansing, MI 48911 and is currently estimated at $173,611, approximately $103 per square foot. 945 W Ller is a home located in Ingham County with nearby schools including Reo Elementary School, Attwood School, and Everett High School.
Ownership History
Date
Name
Owned For
Owner Type
Purchase Details
Closed on
Nov 8, 2024
Sold by
Spalding Thaddeus James
Bought by
Beaudry Daniel
Current Estimated Value
Home Financials for this Owner
Home Financials are based on the most recent Mortgage that was taken out on this home.
Original Mortgage
$155,103
Outstanding Balance
$153,547
Interest Rate
6.08%
Mortgage Type
New Conventional
Estimated Equity
$20,064
Purchase Details
Closed on
Apr 15, 2014
Sold by
Cook Jill K and Sheilds Jill K
Bought by
Spalding Thaddeus James
Home Financials for this Owner
Home Financials are based on the most recent Mortgage that was taken out on this home.
Original Mortgage
$96,021
Interest Rate
4.41%
Mortgage Type
VA
Purchase Details
Closed on
Apr 13, 2005
Sold by
Hutchins Sandra L
Bought by
Cook Jill K
Home Financials for this Owner
Home Financials are based on the most recent Mortgage that was taken out on this home.
Original Mortgage
$125,758
Interest Rate
6.05%
Mortgage Type
FHA
Create a Home Valuation Report for This Property
The Home Valuation Report is an in-depth analysis detailing your home's value as well as a comparison with similar homes in the area
Home Values in the Area
Average Home Value in this Area
Purchase History
| Date | Buyer | Sale Price | Title Company |
|---|---|---|---|
| Beaudry Daniel | $159,900 | Mid Michigan Title | |
| Beaudry Daniel | $159,900 | Mid Michigan Title | |
| Spalding Thaddeus James | $94,000 | Bell Title Co | |
| Cook Jill K | $128,900 | Tri Title Agency |
Source: Public Records
Mortgage History
| Date | Status | Borrower | Loan Amount |
|---|---|---|---|
| Open | Beaudry Daniel | $155,103 | |
| Closed | Beaudry Daniel | $155,103 | |
| Previous Owner | Spalding Thaddeus James | $96,021 | |
| Previous Owner | Cook Jill K | $125,758 |
Source: Public Records
Tax History
| Year | Tax Paid | Tax Assessment Tax Assessment Total Assessment is a certain percentage of the fair market value that is determined by local assessors to be the total taxable value of land and additions on the property. | Land | Improvement |
|---|---|---|---|---|
| 2025 | $2,636 | $83,100 | $12,400 | $70,700 |
| 2024 | $24 | $62,600 | $12,400 | $50,200 |
| 2023 | $2,870 | $55,000 | $12,400 | $42,600 |
| 2022 | $2,587 | $52,200 | $12,600 | $39,600 |
| 2021 | $2,534 | $48,100 | $11,200 | $36,900 |
| 2020 | $2,518 | $45,700 | $11,200 | $34,500 |
| 2019 | $2,414 | $40,400 | $11,200 | $29,200 |
| 2018 | $2,262 | $39,000 | $11,200 | $27,800 |
| 2017 | $2,166 | $39,000 | $11,200 | $27,800 |
| 2016 | $2,054 | $38,400 | $11,200 | $27,200 |
| 2015 | $2,054 | $37,300 | $22,351 | $14,949 |
| 2014 | $2,054 | $36,400 | $26,631 | $9,769 |
Source: Public Records
Map
Nearby Homes
- 1020 R G Curtiss Ave
- 826 R G Curtiss Ave
- 6421 S Washington Ave
- 6037 Hughes Rd
- 5902 Haag Rd
- 5641 Ashley Dr
- 1406 Weymouth Ct
- 6444 Sommerset Rd
- 1309 Penrod Ct
- 5838 S Martin Luther King Junior Blvd
- 5650 Hughes Rd
- 6817 S Washington Ave
- 6429 Rosedale Rd
- 115 E Claremore Dr
- 6246 Gardenia Ave
- 5267 Crocus Ave
- 5815 Caleta Dr
- 125 E Northrup St
- 6935 Vernson Dr
- 208 E Northrup St
Your Personal Tour Guide
Ask me questions while you tour the home.