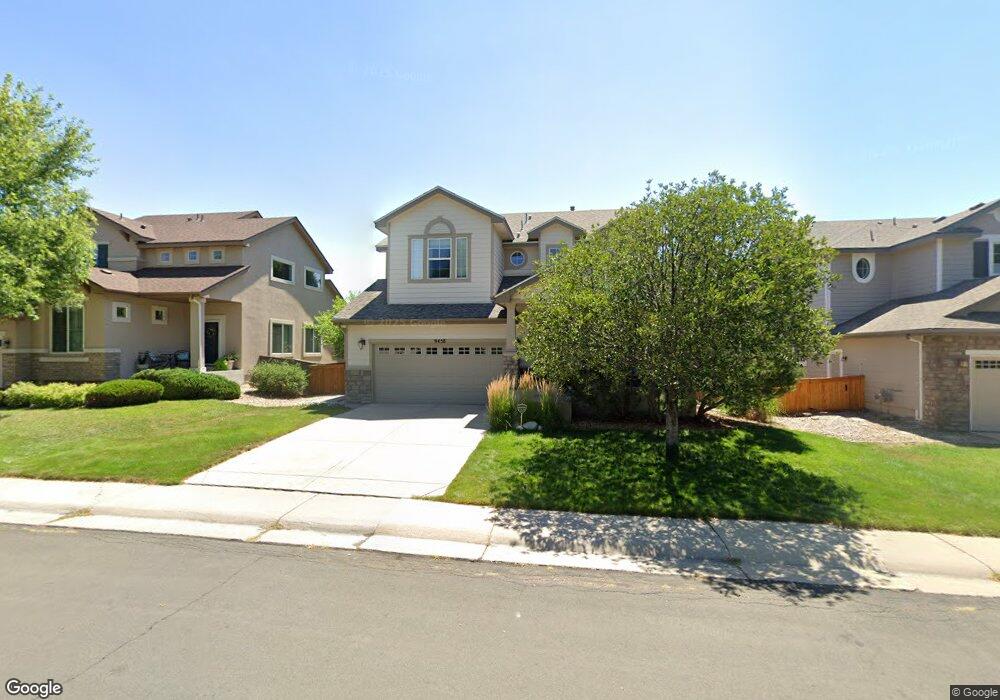
9458 W Gibraltar Place Littleton, CO 80127
Estimated Value: $751,017 - $908,000
4
Beds
3
Baths
3,175
Sq Ft
$265/Sq Ft
Est. Value
About This Home
This home is located at 9458 W Gibraltar Place, Littleton, CO 80127 and is currently estimated at $842,504, approximately $265 per square foot. 9458 W Gibraltar Place is a home located in Jefferson County with nearby schools including Shaffer Elementary School, Falcon Bluffs Middle School, and Chatfield High School.
Ownership History
Date
Name
Owned For
Owner Type
Purchase Details
Closed on
Jul 30, 2010
Sold by
Pollard Kyle and Pollard Alla
Bought by
Allen Jane
Current Estimated Value
Home Financials for this Owner
Home Financials are based on the most recent Mortgage that was taken out on this home.
Original Mortgage
$300,000
Outstanding Balance
$198,329
Interest Rate
4.54%
Mortgage Type
New Conventional
Estimated Equity
$644,175
Purchase Details
Closed on
Aug 26, 2002
Sold by
Pollard Kyle
Bought by
Pollard Kyle and Pollard Alla
Home Financials for this Owner
Home Financials are based on the most recent Mortgage that was taken out on this home.
Original Mortgage
$289,000
Interest Rate
6.33%
Purchase Details
Closed on
Mar 22, 2002
Sold by
Shea Homes Ltd Partnership
Bought by
Pollard Kyle and Pollard Alla
Home Financials for this Owner
Home Financials are based on the most recent Mortgage that was taken out on this home.
Original Mortgage
$283,800
Interest Rate
6.78%
Create a Home Valuation Report for This Property
The Home Valuation Report is an in-depth analysis detailing your home's value as well as a comparison with similar homes in the area
Home Values in the Area
Average Home Value in this Area
Purchase History
| Date | Buyer | Sale Price | Title Company |
|---|---|---|---|
| Allen Jane | $375,000 | Chicago Title Co | |
| Pollard Kyle | -- | -- | |
| Pollard Kyle | -- | -- | |
| Pollard Kyle | $354,807 | North American Title |
Source: Public Records
Mortgage History
| Date | Status | Borrower | Loan Amount |
|---|---|---|---|
| Open | Allen Jane | $300,000 | |
| Previous Owner | Pollard Kyle | $289,000 | |
| Previous Owner | Pollard Kyle | $283,800 |
Source: Public Records
Tax History Compared to Growth
Tax History
| Year | Tax Paid | Tax Assessment Tax Assessment Total Assessment is a certain percentage of the fair market value that is determined by local assessors to be the total taxable value of land and additions on the property. | Land | Improvement |
|---|---|---|---|---|
| 2024 | $4,103 | $43,495 | $12,307 | $31,188 |
| 2023 | $4,103 | $43,495 | $12,307 | $31,188 |
| 2022 | $3,797 | $39,521 | $11,273 | $28,248 |
| 2021 | $3,863 | $40,658 | $11,597 | $29,061 |
| 2020 | $3,477 | $36,695 | $9,824 | $26,871 |
| 2019 | $3,450 | $36,695 | $9,824 | $26,871 |
| 2018 | $3,008 | $32,343 | $8,836 | $23,507 |
| 2017 | $3,429 | $32,343 | $8,836 | $23,507 |
| 2016 | $3,499 | $30,016 | $8,253 | $21,763 |
| 2015 | $3,211 | $30,016 | $8,253 | $21,763 |
| 2014 | $3,211 | $26,284 | $7,490 | $18,794 |
Source: Public Records
Map
Nearby Homes
- 9407 W Gibraltar Place
- 9796 W Freiburg Dr Unit H
- 9896 W Freiburg Dr Unit 1B
- 9896 W Freiburg Dr Unit 1D
- 9876 W Freiburg Dr Unit F
- 9836 W Freiburg Dr Unit 4B
- 9788 S Johnson Way
- 8532 W Eden Dr
- 9610 S Dover Way
- 9992 W Victoria Place Unit 103
- 10062 W Victoria Place Unit 205
- 9962 W Victoria Place Unit 102
- 10061 W Victoria Place Unit 204
- 10056 W Unser Dr Unit 204
- 9367 W Vandeventor Dr
- 8808 S Kipling Way Unit 202
- 8779 S Kipling Way Unit 105
- 8778 S Kipling Way Unit 108
- 8778 S Kipling Way Unit 304
- 8778 S Kipling Way Unit 303
- 9478 W Gibraltar Place
- 9438 W Gibraltar Place
- 9498 W Gibraltar Place
- 9418 W Gibraltar Place
- 9457 W Gibraltar Place
- 9518 W Gibraltar Place
- 9408 W Gibraltar Place
- 9437 W Gibraltar Place
- 9892 S Hoyt Ct
- 9417 W Gibraltar Place
- 9548 W Gibraltar Place
- 9398 W Gibraltar Place
- 9872 S Hoyt Ct
- 9568 W Gibraltar Place
- 9388 W Gibraltar Place
- 9867 S Holland St
- 9862 S Hoyt Ct
- 9893 S Hoyt Ct
- 9466 W Freiburg Place
- 9883 S Hoyt Ct