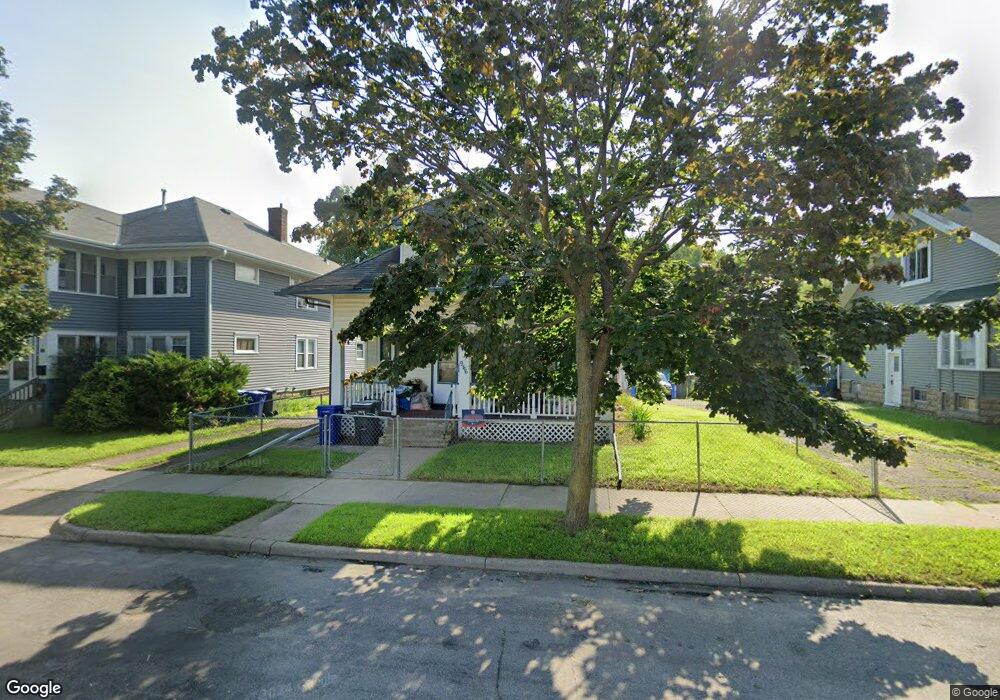
946 Burr St Saint Paul, MN 55130
Payne-Phalen NeighborhoodEstimated Value: $220,000 - $258,253
3
Beds
2
Baths
2,222
Sq Ft
$108/Sq Ft
Est. Value
About This Home
This home is located at 946 Burr St, Saint Paul, MN 55130 and is currently estimated at $239,563, approximately $107 per square foot. 946 Burr St is a home located in Ramsey County with nearby schools including Bruce F Vento Elementary School, Uncommon Schools Camden Prep - Mt. Ephraim Campus, and Creative Arts Secondary School.
Ownership History
Date
Name
Owned For
Owner Type
Purchase Details
Closed on
Jan 21, 2020
Sold by
Wall Nicholas and Wall Amanda G
Bought by
Her Vang
Current Estimated Value
Home Financials for this Owner
Home Financials are based on the most recent Mortgage that was taken out on this home.
Original Mortgage
$171,957
Outstanding Balance
$152,310
Interest Rate
3.73%
Mortgage Type
FHA
Estimated Equity
$87,253
Purchase Details
Closed on
Dec 18, 2003
Sold by
Ly Chia Neong and Toulouse Noel
Bought by
Toulouse Noel and Toulouse Florence Ly
Purchase Details
Closed on
Oct 17, 1999
Sold by
Hud
Bought by
Neng Ly Chiu and Heu Vang Sy
Create a Home Valuation Report for This Property
The Home Valuation Report is an in-depth analysis detailing your home's value as well as a comparison with similar homes in the area
Home Values in the Area
Average Home Value in this Area
Purchase History
| Date | Buyer | Sale Price | Title Company |
|---|---|---|---|
| Her Vang | $176,000 | Results Title | |
| Toulouse Noel | $94,000 | -- | |
| Neng Ly Chiu | $62,000 | -- |
Source: Public Records
Mortgage History
| Date | Status | Borrower | Loan Amount |
|---|---|---|---|
| Open | Her Vang | $171,957 |
Source: Public Records
Tax History Compared to Growth
Tax History
| Year | Tax Paid | Tax Assessment Tax Assessment Total Assessment is a certain percentage of the fair market value that is determined by local assessors to be the total taxable value of land and additions on the property. | Land | Improvement |
|---|---|---|---|---|
| 2025 | $5,640 | $243,300 | $25,000 | $218,300 |
| 2023 | $5,640 | $217,500 | $20,000 | $197,500 |
| 2022 | $2,768 | $231,800 | $20,000 | $211,800 |
| 2021 | $2,310 | $185,800 | $20,000 | $165,800 |
| 2020 | $2,296 | $164,300 | $8,500 | $155,800 |
| 2019 | $2,150 | $154,200 | $8,500 | $145,700 |
| 2018 | $1,828 | $144,300 | $8,500 | $135,800 |
| 2017 | $1,388 | $130,300 | $8,500 | $121,800 |
| 2016 | $1,466 | $0 | $0 | $0 |
| 2015 | $1,426 | $110,800 | $8,500 | $102,300 |
| 2014 | $1,444 | $0 | $0 | $0 |
Source: Public Records
Map
Nearby Homes