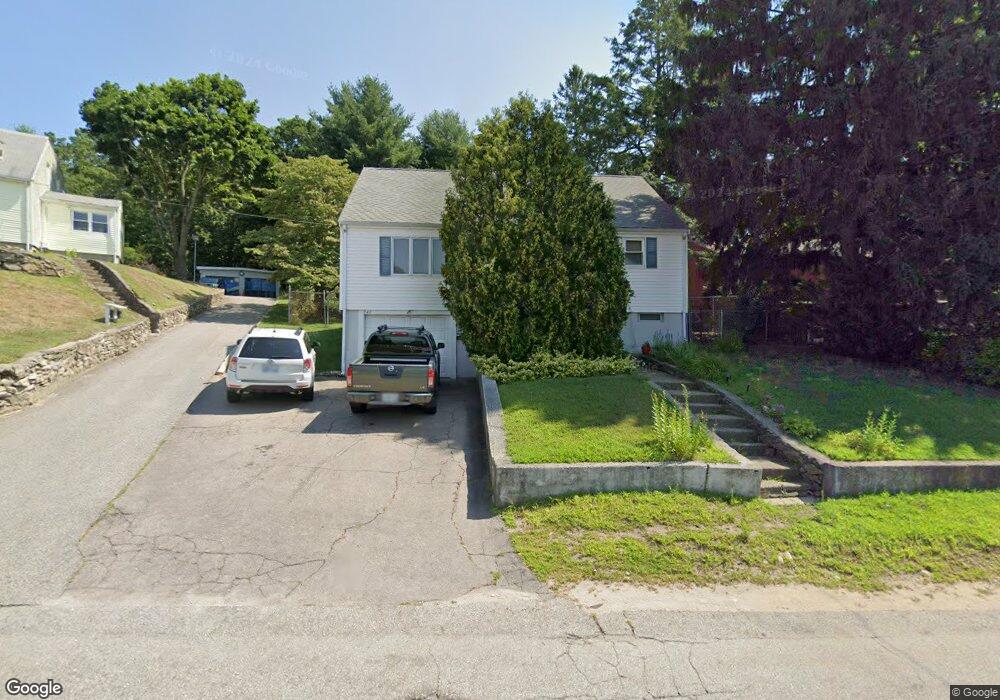
946 Elm St Woonsocket, RI 02895
East Woonsocket NeighborhoodEstimated Value: $369,109 - $434,000
2
Beds
1
Bath
1,008
Sq Ft
$394/Sq Ft
Est. Value
About This Home
This home is located at 946 Elm St, Woonsocket, RI 02895 and is currently estimated at $396,777, approximately $393 per square foot. 946 Elm St is a home located in Providence County with nearby schools including Woonsocket High School and Good Shepherd Catholic School.
Ownership History
Date
Name
Owned For
Owner Type
Purchase Details
Closed on
Jun 2, 2000
Sold by
Menard Scott M and Menard Sharon C
Bought by
Wollen Timothy M
Current Estimated Value
Purchase Details
Closed on
May 17, 1990
Sold by
Blanchard Michael R
Bought by
Menard Scott M
Home Financials for this Owner
Home Financials are based on the most recent Mortgage that was taken out on this home.
Original Mortgage
$107,300
Interest Rate
10.14%
Mortgage Type
Purchase Money Mortgage
Create a Home Valuation Report for This Property
The Home Valuation Report is an in-depth analysis detailing your home's value as well as a comparison with similar homes in the area
Home Values in the Area
Average Home Value in this Area
Purchase History
| Date | Buyer | Sale Price | Title Company |
|---|---|---|---|
| Wollen Timothy M | $110,000 | -- | |
| Wollen Timothy M | $110,000 | -- | |
| Menard Scott M | $113,000 | -- |
Source: Public Records
Mortgage History
| Date | Status | Borrower | Loan Amount |
|---|---|---|---|
| Previous Owner | Menard Scott M | $107,300 |
Source: Public Records
Tax History
| Year | Tax Paid | Tax Assessment Tax Assessment Total Assessment is a certain percentage of the fair market value that is determined by local assessors to be the total taxable value of land and additions on the property. | Land | Improvement |
|---|---|---|---|---|
| 2025 | $3,966 | $353,200 | $111,300 | $241,900 |
| 2024 | $3,746 | $257,600 | $98,700 | $158,900 |
| 2023 | $3,601 | $257,600 | $98,700 | $158,900 |
| 2022 | $3,601 | $257,600 | $98,700 | $158,900 |
| 2021 | $4,330 | $182,300 | $65,500 | $116,800 |
| 2020 | $4,375 | $182,300 | $65,500 | $116,800 |
| 2018 | $4,390 | $182,300 | $65,500 | $116,800 |
| 2017 | $3,919 | $130,200 | $48,500 | $81,700 |
| 2016 | $4,146 | $130,200 | $48,500 | $81,700 |
| 2015 | $4,763 | $130,200 | $48,500 | $81,700 |
| 2014 | $3,394 | $134,900 | $53,300 | $81,600 |
Source: Public Records
Map
Nearby Homes
- 568 Elm St
- 34 Heroux Ave
- 68 Kenwood St
- 95 Mitris Blvd
- 372 Cumberland Hill Rd
- 56 Mailloux St
- 375 Congress St
- 311 Elm St
- 271 Elm St
- 263 Elm St
- 727 Mendon Rd
- 40 Burnside Ave
- 212 Saint Louis Ave
- 89 Saint Agnes Ave
- 7 Theresa Marie Ave
- 188 Saint Louis Ave
- 178 Saint Louis Ave
- 551 Wood Ave
- 1088 Diamond Hill Rd
- 538 Wood Ave
Your Personal Tour Guide
Ask me questions while you tour the home.