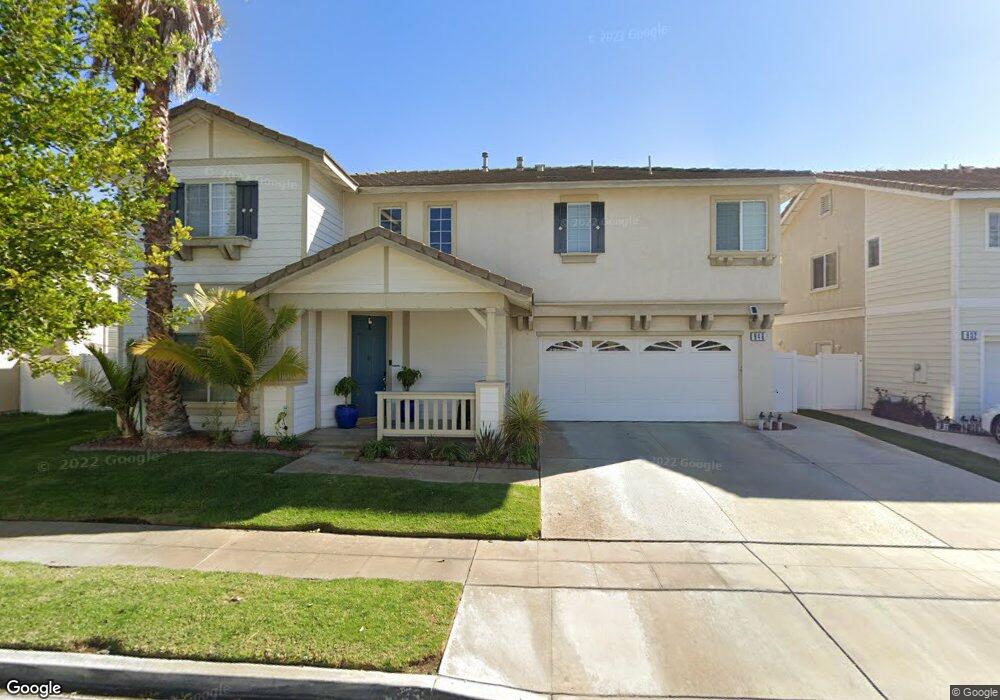
946 Taylor Ln Fillmore, CA 93015
Estimated Value: $813,652 - $1,088,000
4
Beds
3
Baths
2,478
Sq Ft
$367/Sq Ft
Est. Value
About This Home
This home is located at 946 Taylor Ln, Fillmore, CA 93015 and is currently estimated at $908,413, approximately $366 per square foot. 946 Taylor Ln is a home located in Ventura County with nearby schools including Fillmore Senior High.
Ownership History
Date
Name
Owned For
Owner Type
Purchase Details
Closed on
Apr 6, 2006
Sold by
Basaldua Martin and Basaldua Mandi
Bought by
Huerta Charles E and Huerta Hilda Hernandez
Current Estimated Value
Home Financials for this Owner
Home Financials are based on the most recent Mortgage that was taken out on this home.
Original Mortgage
$95,550
Interest Rate
5.95%
Mortgage Type
Stand Alone Second
Purchase Details
Closed on
Mar 21, 2002
Sold by
Griffin Homebuilding Group Llc
Bought by
Basaldua Martin and Basaldua Mandi
Home Financials for this Owner
Home Financials are based on the most recent Mortgage that was taken out on this home.
Original Mortgage
$278,750
Interest Rate
6.52%
Create a Home Valuation Report for This Property
The Home Valuation Report is an in-depth analysis detailing your home's value as well as a comparison with similar homes in the area
Home Values in the Area
Average Home Value in this Area
Purchase History
| Date | Buyer | Sale Price | Title Company |
|---|---|---|---|
| Huerta Charles E | $637,000 | Lawyers Title Company 81 | |
| Basaldua Martin | $328,000 | First American Title Ins Co |
Source: Public Records
Mortgage History
| Date | Status | Borrower | Loan Amount |
|---|---|---|---|
| Closed | Huerta Charles E | $95,550 | |
| Open | Huerta Charles E | $509,600 | |
| Previous Owner | Basaldua Martin | $278,750 |
Source: Public Records
Tax History Compared to Growth
Tax History
| Year | Tax Paid | Tax Assessment Tax Assessment Total Assessment is a certain percentage of the fair market value that is determined by local assessors to be the total taxable value of land and additions on the property. | Land | Improvement |
|---|---|---|---|---|
| 2025 | $9,812 | $775,000 | $505,000 | $270,000 |
| 2024 | $9,812 | $771,000 | $502,000 | $269,000 |
| 2023 | $9,522 | $741,000 | $482,000 | $259,000 |
| 2022 | $8,614 | $704,000 | $458,000 | $246,000 |
| 2021 | $8,848 | $629,000 | $410,000 | $219,000 |
| 2020 | $7,283 | $536,000 | $349,000 | $187,000 |
| 2019 | $7,073 | $509,000 | $331,000 | $178,000 |
| 2018 | $6,796 | $488,000 | $317,000 | $171,000 |
| 2017 | $6,894 | $486,000 | $316,000 | $170,000 |
| 2016 | $6,046 | $443,000 | $288,000 | $155,000 |
| 2015 | $6,082 | $453,000 | $295,000 | $158,000 |
| 2014 | $5,813 | $423,000 | $275,000 | $148,000 |
Source: Public Records
Map
Nearby Homes