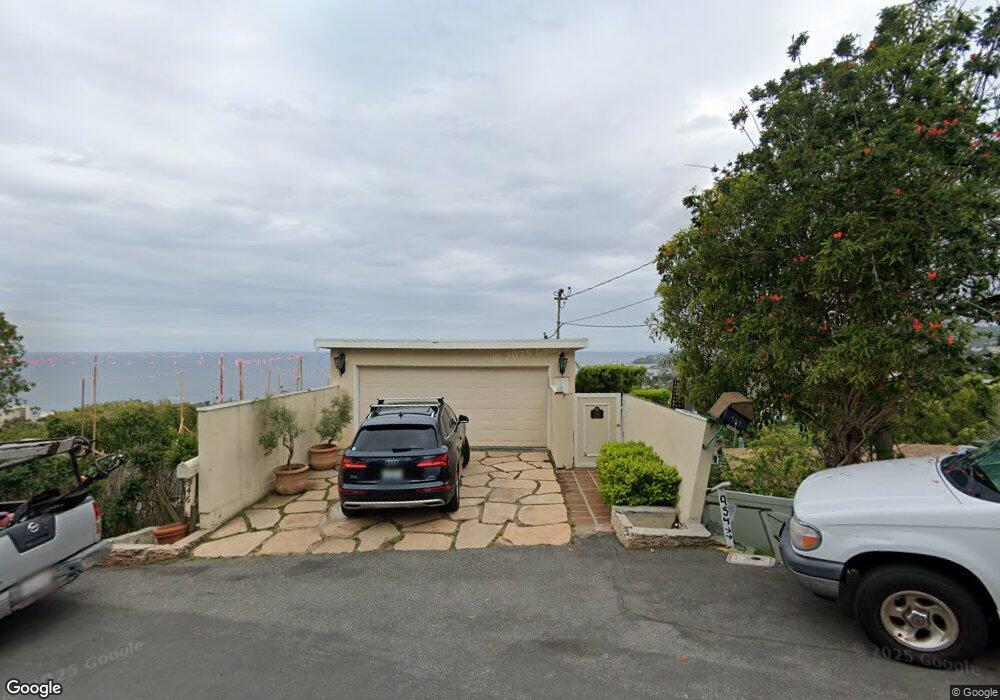
946 Van Dyke Dr Laguna Beach, CA 92651
Estimated Value: $2,464,887 - $3,249,000
3
Beds
4
Baths
2,143
Sq Ft
$1,359/Sq Ft
Est. Value
About This Home
This home is located at 946 Van Dyke Dr, Laguna Beach, CA 92651 and is currently estimated at $2,912,722, approximately $1,359 per square foot. 946 Van Dyke Dr is a home located in Orange County with nearby schools including Top Of The World Elementary School, Thurston Middle School, and Laguna Beach High School.
Ownership History
Date
Name
Owned For
Owner Type
Purchase Details
Closed on
Apr 27, 2016
Sold by
Ghormley Scott L
Bought by
Ghormley Scott L and Scott L Ghormley Trust
Current Estimated Value
Purchase Details
Closed on
Jun 29, 1999
Sold by
Floyd John L
Bought by
Ghormley Scott L
Home Financials for this Owner
Home Financials are based on the most recent Mortgage that was taken out on this home.
Original Mortgage
$616,000
Outstanding Balance
$166,557
Interest Rate
7.12%
Estimated Equity
$2,746,165
Purchase Details
Closed on
Nov 21, 1997
Sold by
Kean Dudley B
Bought by
Floyd John L
Home Financials for this Owner
Home Financials are based on the most recent Mortgage that was taken out on this home.
Original Mortgage
$464,000
Interest Rate
4.95%
Create a Home Valuation Report for This Property
The Home Valuation Report is an in-depth analysis detailing your home's value as well as a comparison with similar homes in the area
Purchase History
| Date | Buyer | Sale Price | Title Company |
|---|---|---|---|
| Ghormley Scott L | -- | None Available | |
| Ghormley Scott L | $880,000 | Chicago Title Co | |
| Floyd John L | -- | -- |
Source: Public Records
Mortgage History
| Date | Status | Borrower | Loan Amount |
|---|---|---|---|
| Open | Ghormley Scott L | $616,000 | |
| Previous Owner | Floyd John L | $464,000 | |
| Closed | Ghormley Scott L | $100,001 |
Source: Public Records
Tax History
| Year | Tax Paid | Tax Assessment Tax Assessment Total Assessment is a certain percentage of the fair market value that is determined by local assessors to be the total taxable value of land and additions on the property. | Land | Improvement |
|---|---|---|---|---|
| 2025 | $14,210 | $1,352,540 | $1,180,734 | $171,806 |
| 2024 | $14,210 | $1,326,020 | $1,157,582 | $168,438 |
| 2023 | $14,352 | $1,300,020 | $1,134,884 | $165,136 |
| 2022 | $14,020 | $1,274,530 | $1,112,631 | $161,899 |
| 2021 | $13,691 | $1,249,540 | $1,090,815 | $158,725 |
| 2020 | $13,484 | $1,236,728 | $1,079,630 | $157,098 |
| 2019 | $13,227 | $1,212,479 | $1,058,461 | $154,018 |
| 2018 | $12,954 | $1,188,705 | $1,037,706 | $150,999 |
| 2017 | $12,679 | $1,165,398 | $1,017,359 | $148,039 |
| 2016 | $12,421 | $1,142,548 | $997,411 | $145,137 |
| 2015 | $12,214 | $1,125,386 | $982,429 | $142,957 |
| 2014 | $11,968 | $1,103,342 | $963,185 | $140,157 |
Source: Public Records
Map
Nearby Homes
- 815 Bluebird Canyon Dr
- 686 Diamond St
- 856 Diamond St
- 702 Diamond St
- 1177 Temple Hills Dr
- 464 Agate St Unit A/B
- 630 Diamond St
- 1585 Catalina
- 2100 Crestview Dr
- 840 Gainsborough Dr
- 617 Lombardy Ln
- 468 Ruby St
- 684 Seaview St
- 1603 S Coast Hwy Unit F
- 1081 S Coast Hwy
- 800 San Jose St
- 1477 Cerritos Dr
- 1585 S Coast Hwy Unit 47
- 1585 S Coast Hwy Unit 32
- 1585 S Coast Hwy Unit 65
- 945 Rembrandt Dr
- 954 Van Dyke Dr
- 917 Rembrandt Dr
- 926 Van Dyke Dr
- 964 Van Dyke Dr
- 918 Van Dyke Dr
- 949 Van Dyke Dr
- 926 Rembrandt Dr
- 920 Rembrandt Dr
- 940 Rembrandt Dr
- 932 Rembrandt Dr
- 914 Rembrandt Dr
- 982 Van Dyke Dr
- 906 Van Dyke Dr
- 954 Rembrandt Dr
- 908 Rembrandt Dr
- 901 Van Dyke Dr
- 989 Van Dyke Dr
- 984 Van Dyke Dr
- 888 Van Dyke Dr
Your Personal Tour Guide
Ask me questions while you tour the home.