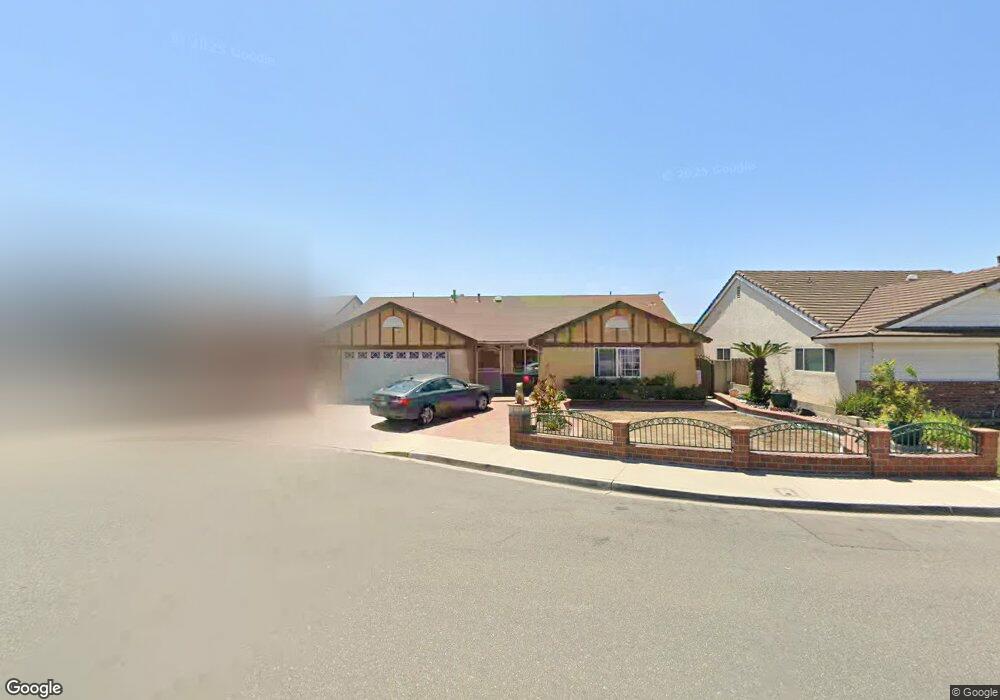
9462 Asbury Cir Westminster, CA 92683
Star View NeighborhoodEstimated Value: $1,168,000 - $1,204,000
3
Beds
3
Baths
1,972
Sq Ft
$602/Sq Ft
Est. Value
About This Home
This home is located at 9462 Asbury Cir, Westminster, CA 92683 and is currently estimated at $1,187,848, approximately $602 per square foot. 9462 Asbury Cir is a home located in Orange County with nearby schools including Leo Carrillo Elementary School, McGarvin Intermediate School, and La Quinta High School.
Ownership History
Date
Name
Owned For
Owner Type
Purchase Details
Closed on
Aug 15, 2012
Sold by
Tran Danicci Kim
Bought by
Tran Danicci Kim and The Danicci Kim Tran Living Trust
Current Estimated Value
Purchase Details
Closed on
May 7, 2012
Sold by
Tran Danicci Kim
Bought by
Tran Danicci Kim and The Danicci Kim Tran Living Trust
Purchase Details
Closed on
Apr 27, 2001
Sold by
Le Quoc Bao
Bought by
Tran Danicci Kim
Home Financials for this Owner
Home Financials are based on the most recent Mortgage that was taken out on this home.
Original Mortgage
$223,200
Outstanding Balance
$80,665
Interest Rate
6.92%
Estimated Equity
$1,107,183
Purchase Details
Closed on
Mar 23, 2001
Sold by
Cody Cheryl A
Bought by
Tran Danicci Kim
Home Financials for this Owner
Home Financials are based on the most recent Mortgage that was taken out on this home.
Original Mortgage
$223,200
Outstanding Balance
$80,665
Interest Rate
6.92%
Estimated Equity
$1,107,183
Create a Home Valuation Report for This Property
The Home Valuation Report is an in-depth analysis detailing your home's value as well as a comparison with similar homes in the area
Home Values in the Area
Average Home Value in this Area
Purchase History
| Date | Buyer | Sale Price | Title Company |
|---|---|---|---|
| Tran Danicci Kim | -- | Accommodation | |
| Tran Danicci Kim | -- | Accommodation | |
| Tran Danicci Kim | -- | None Available | |
| Tran Danicci Kim | -- | South Coast Title Company | |
| Tran Danicci Kim | $279,000 | South Coast Title Company |
Source: Public Records
Mortgage History
| Date | Status | Borrower | Loan Amount |
|---|---|---|---|
| Open | Tran Danicci Kim | $223,200 |
Source: Public Records
Tax History Compared to Growth
Tax History
| Year | Tax Paid | Tax Assessment Tax Assessment Total Assessment is a certain percentage of the fair market value that is determined by local assessors to be the total taxable value of land and additions on the property. | Land | Improvement |
|---|---|---|---|---|
| 2025 | $5,140 | $420,399 | $289,108 | $131,291 |
| 2024 | $5,140 | $412,156 | $283,439 | $128,717 |
| 2023 | $5,039 | $404,075 | $277,881 | $126,194 |
| 2022 | $4,927 | $396,152 | $272,432 | $123,720 |
| 2021 | $4,855 | $388,385 | $267,090 | $121,295 |
| 2020 | $4,793 | $384,403 | $264,351 | $120,052 |
| 2019 | $4,705 | $376,866 | $259,167 | $117,699 |
| 2018 | $4,615 | $369,477 | $254,085 | $115,392 |
| 2017 | $4,555 | $362,233 | $249,103 | $113,130 |
| 2016 | $4,368 | $355,131 | $244,219 | $110,912 |
| 2015 | $4,310 | $349,797 | $240,551 | $109,246 |
| 2014 | $4,209 | $342,945 | $235,838 | $107,107 |
Source: Public Records
Map
Nearby Homes
- 15690 Poinsettia Way
- 15710 Poinsettia Way
- 9831 Cloverdale Ave
- 15300 Magnolia St Unit 71
- 9190 Poppy Cir
- 15781 Clarendon St
- 15110 Henley Dr Unit 51
- 8961 Emerald Ave
- 9851 Bolsa Ave Unit 198
- 9851 Bolsa Ave Unit 20
- 8822 Palos Verdes Ave
- 9801 Hibiscus Ave
- 10091 Bolsa Ave
- 10200 Bolsa Ave Unit 23
- 10200 Bolsa Ave
- 8862 Ovieda Plaza
- 14892 Valencia Plaza
- 9932 Newcastle Ave
- 9132 Hazard Ave
- 9485 Geranium Cir
- 9452 Asbury Cir
- 9472 Asbury Cir
- 9461 Downing Cir
- 9471 Downing Cir
- 9451 Downing Cir
- 9442 Asbury Cir
- 9482 Asbury Cir
- 9441 Downing Cir
- 9461 Asbury Cir
- 9451 Asbury Cir
- 9481 Downing Cir
- 9481 Asbury Cir
- 9432 Asbury Cir
- 9471 Asbury Cir
- 9441 Asbury Cir
- 9431 Downing Cir
- 9431 Asbury Cir
- 9482 Downing Cir
- 9422 Asbury Cir
- 9462 Bevan Ave