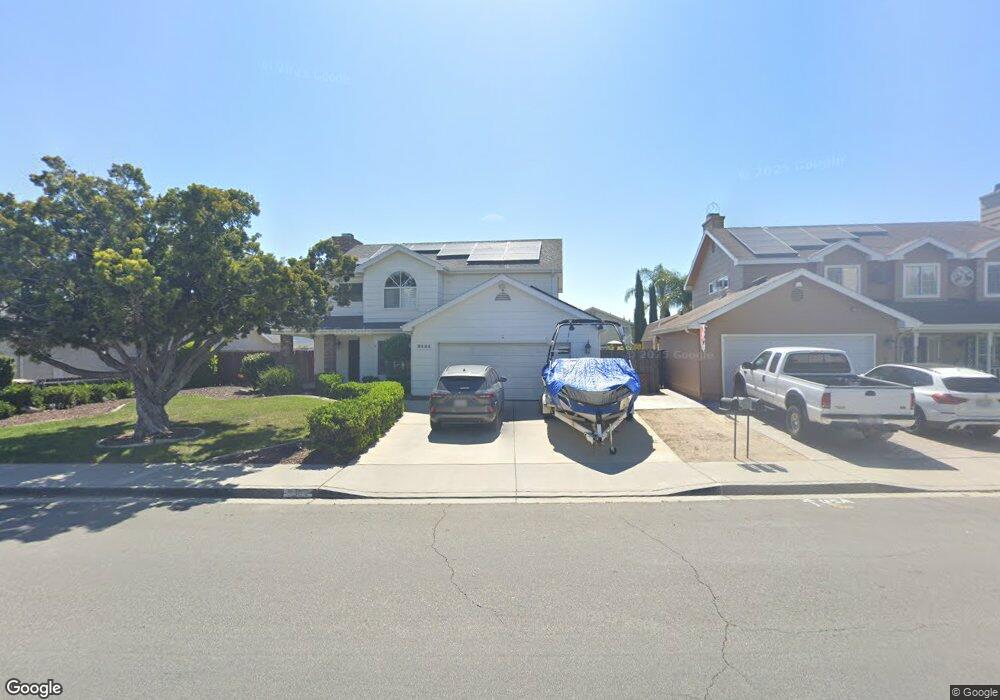
9464 Darling Rd Ventura, CA 93004
Serra NeighborhoodEstimated Value: $947,000 - $1,011,000
3
Beds
3
Baths
1,997
Sq Ft
$494/Sq Ft
Est. Value
About This Home
This home is located at 9464 Darling Rd, Ventura, CA 93004 and is currently estimated at $985,683, approximately $493 per square foot. 9464 Darling Rd is a home located in Ventura County with nearby schools including Citrus Glen Elementary School, Balboa Middle School, and Buena High School.
Ownership History
Date
Name
Owned For
Owner Type
Purchase Details
Closed on
Aug 30, 2004
Sold by
Seemiller Daniel and Seemiller Susan Simmons
Bought by
Castro Christopher Charles and Castro Shannon Noel
Current Estimated Value
Home Financials for this Owner
Home Financials are based on the most recent Mortgage that was taken out on this home.
Original Mortgage
$479,999
Outstanding Balance
$159,391
Interest Rate
1%
Mortgage Type
Negative Amortization
Estimated Equity
$826,292
Purchase Details
Closed on
Jul 18, 1996
Sold by
Seemiller Daniel and Seemiller Susan M
Bought by
Seemiller Daniel and Seemiller Susan Simmons
Create a Home Valuation Report for This Property
The Home Valuation Report is an in-depth analysis detailing your home's value as well as a comparison with similar homes in the area
Home Values in the Area
Average Home Value in this Area
Purchase History
| Date | Buyer | Sale Price | Title Company |
|---|---|---|---|
| Castro Christopher Charles | $600,000 | Ticor Title Company | |
| Seemiller Daniel | -- | -- |
Source: Public Records
Mortgage History
| Date | Status | Borrower | Loan Amount |
|---|---|---|---|
| Open | Castro Christopher Charles | $479,999 | |
| Closed | Castro Christopher Charles | $60,000 |
Source: Public Records
Tax History
| Year | Tax Paid | Tax Assessment Tax Assessment Total Assessment is a certain percentage of the fair market value that is determined by local assessors to be the total taxable value of land and additions on the property. | Land | Improvement |
|---|---|---|---|---|
| 2025 | $8,975 | $834,940 | $627,255 | $207,685 |
| 2024 | $8,975 | $818,569 | $614,956 | $203,613 |
| 2023 | $8,875 | $802,519 | $602,898 | $199,621 |
| 2022 | $8,246 | $786,784 | $591,077 | $195,707 |
| 2021 | $7,801 | $742,000 | $558,000 | $184,000 |
| 2020 | $7,042 | $668,000 | $502,000 | $166,000 |
| 2019 | $6,677 | $632,000 | $475,000 | $157,000 |
| 2018 | $7,078 | $669,000 | $503,000 | $166,000 |
| 2017 | $6,825 | $644,000 | $484,000 | $160,000 |
| 2016 | $6,733 | $634,000 | $476,000 | $158,000 |
| 2015 | $5,642 | $530,000 | $398,000 | $132,000 |
| 2014 | $6,414 | $601,000 | $340,000 | $261,000 |
Source: Public Records
Map
Nearby Homes
- 9417 Petit Cir
- 9419 Petit Ct
- 650 Charleston Place
- 8582 Hollister St
- 8527 Eureka St
- 9813 Sweetwater Ln
- 9998 Jamestown St
- 10101 Telephone Rd
- 1297 Halifax Ct
- 8345 Balboa St
- 8265 Quartz St
- 8240 Silver Cir
- 8272 Tiara St
- 8317 Wabash St
- 290 Dana Point Ave
- 8617 Fairford St
- 9050 Feather St
- 1572 Winford Ave
- 1651 Delores Ct
- 204 Banner Ave
- 9436 Darling Rd
- 9492 Darling Rd Unit ADU
- 9492 Darling Rd Unit East Ventura Apartme
- 9492 Darling Rd
- 741 Albany Ave
- 790 Petit Ave
- 795 Albany Ave
- 767 Albany Ave
- 802 Petit Ave
- 804 S Petit Ave
- 804 Petit Ave
- 700 Albany Ave
- 722 Albany Ave
- 9501 Darling Rd
- 746 Albany Ave
- 807 Albany Ave
- 808 Petit Ave
- 9517 Darling Rd
- 768 Albany Ave
- 9382 Waco St
Your Personal Tour Guide
Ask me questions while you tour the home.