9464 Sunglow Ct Rancho Cucamonga, CA 91730
Estimated Value: $936,310 - $1,020,000
3
Beds
4
Baths
3,771
Sq Ft
$255/Sq Ft
Est. Value
About This Home
This home is located at 9464 Sunglow Ct, Rancho Cucamonga, CA 91730 and is currently estimated at $962,328, approximately $255 per square foot. 9464 Sunglow Ct is a home located in San Bernardino County with nearby schools including Ontario Center School, Rancho Cucamonga Middle, and Colony High.
Ownership History
Date
Name
Owned For
Owner Type
Purchase Details
Closed on
Sep 3, 2002
Sold by
Centex Homes
Bought by
Lansang Romeo L and Lansang Christine M
Current Estimated Value
Home Financials for this Owner
Home Financials are based on the most recent Mortgage that was taken out on this home.
Original Mortgage
$391,850
Interest Rate
5.99%
Create a Home Valuation Report for This Property
The Home Valuation Report is an in-depth analysis detailing your home's value as well as a comparison with similar homes in the area
Purchase History
| Date | Buyer | Sale Price | Title Company |
|---|---|---|---|
| Lansang Romeo L | $461,000 | Commerce Title Company |
Source: Public Records
Mortgage History
| Date | Status | Borrower | Loan Amount |
|---|---|---|---|
| Previous Owner | Lansang Romeo L | $391,850 |
Source: Public Records
Tax History
| Year | Tax Paid | Tax Assessment Tax Assessment Total Assessment is a certain percentage of the fair market value that is determined by local assessors to be the total taxable value of land and additions on the property. | Land | Improvement |
|---|---|---|---|---|
| 2025 | $8,370 | $667,687 | $233,689 | $433,998 |
| 2024 | $8,157 | $654,595 | $229,107 | $425,488 |
| 2023 | $7,976 | $641,760 | $224,615 | $417,145 |
| 2022 | $7,832 | $629,177 | $220,211 | $408,966 |
| 2021 | $7,753 | $616,840 | $215,893 | $400,947 |
| 2020 | $7,614 | $610,515 | $213,679 | $396,836 |
| 2019 | $7,559 | $598,544 | $209,489 | $389,055 |
| 2018 | $7,378 | $586,807 | $205,381 | $381,426 |
| 2017 | $7,128 | $575,301 | $201,354 | $373,947 |
| 2016 | $7,030 | $564,021 | $197,406 | $366,615 |
| 2015 | $6,970 | $555,549 | $194,441 | $361,108 |
| 2014 | $6,771 | $544,666 | $190,632 | $354,034 |
Source: Public Records
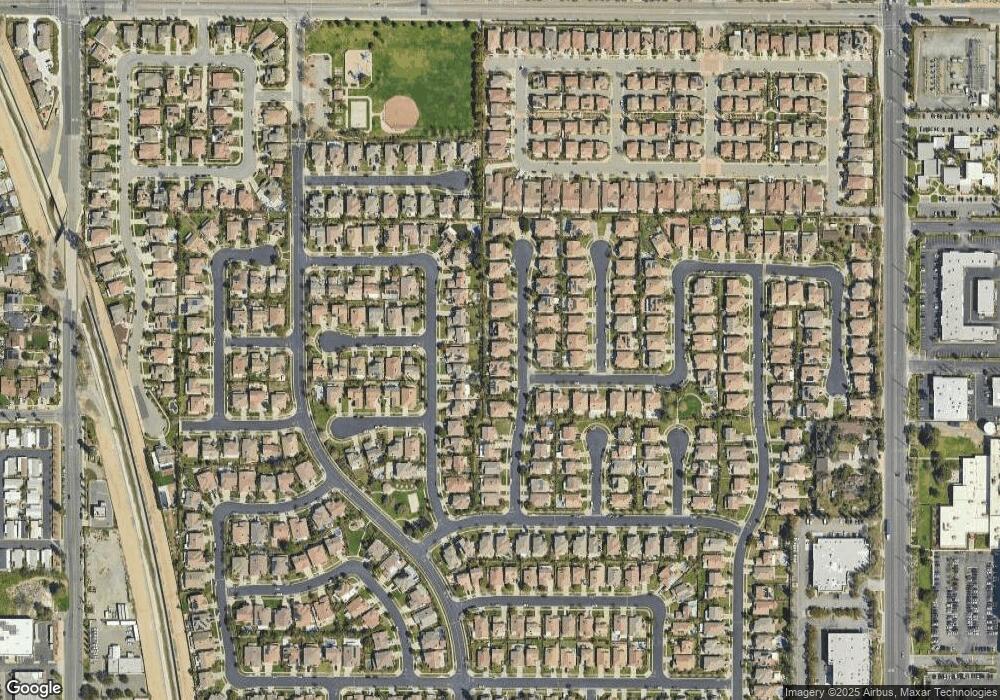
Map
Nearby Homes
- 9522 Harvest Vista Dr
- 9412 Archibald Ave
- 9330 Alderwood Dr
- 2139 Fourth St
- 1342 N Isadora Way
- 2139 E 4th St #244 St Unit 244
- 2076 E Sentinel Privado
- 2072 E Sentinel Privado
- 2139 E 4th St Unit 13
- 2139 E 4th St Unit 79
- 2139 E 4th St Unit 244
- 2139 E 4th St Unit 39
- 2139 E 4th St Unit 84
- 1978 E 5th St
- 1985 E Harvard Privado Unit A
- 1908 E Alondra Ct
- 1434 N San Diego Place
- 2841 E Via Terrano
- 2873 E Via Terrano
- 2908 E Via Fiano
- 9454 Sunglow Ct
- 9472 Sunglow Ct
- 9473 Mountain Shadows Place
- 9463 Mountain Shadows Place
- 9446 Sunglow Ct
- 9482 Sunglow Ct
- 9483 Mountain Shadows Place
- 9453 Mountain Shadows Place
- 9461 Sunglow Ct
- 9469 Sunglow Ct
- 9457 Sunglow Ct
- 9493 Mountain Shadows Place
- 9436 Sunglow Ct
- 9498 Sunglow Ct
- 9443 Mountain Shadows Place
- 9443 Sunglow Ct
- 9531 Pinewood Dr
- 9495 Mountain Shadows Place
- 9468 Canyon Oaks Ct
- 9433 Mountain Shadows Place
Your Personal Tour Guide
Ask me questions while you tour the home.