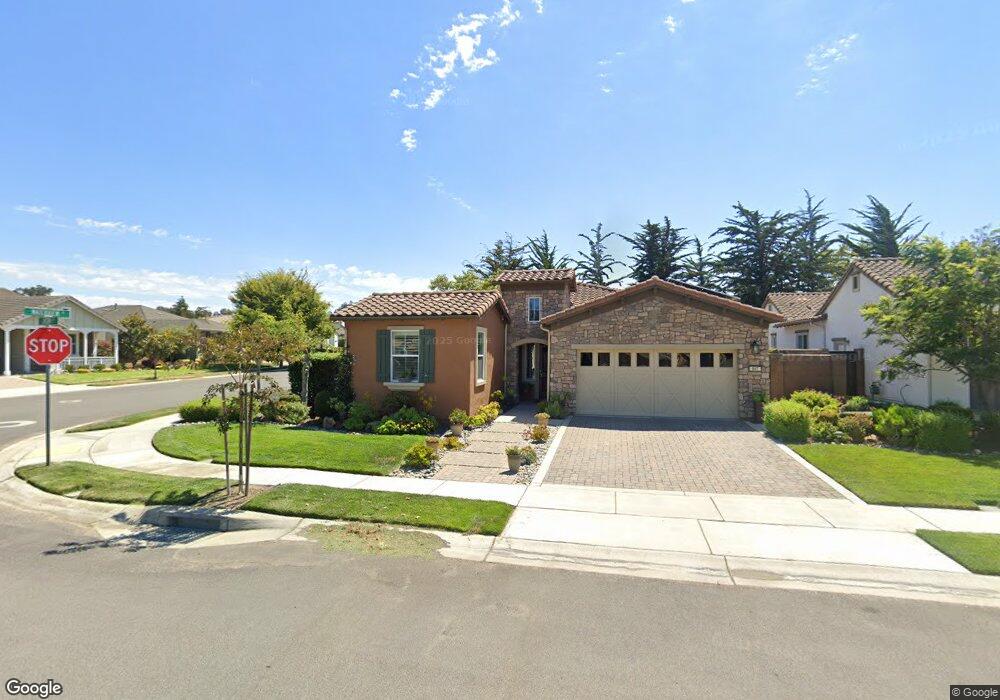
947 Jason Ct Nipomo, CA 93444
Woodlands NeighborhoodEstimated Value: $1,081,633 - $1,117,000
2
Beds
2
Baths
1,669
Sq Ft
$655/Sq Ft
Est. Value
About This Home
This home is located at 947 Jason Ct, Nipomo, CA 93444 and is currently estimated at $1,093,908, approximately $655 per square foot. 947 Jason Ct is a home located in San Luis Obispo County with nearby schools including Dorothea Lange Elementary School, Mesa Middle School, and Nipomo High School.
Ownership History
Date
Name
Owned For
Owner Type
Purchase Details
Closed on
Sep 11, 2012
Sold by
Vicory William M and Vicory Jeanne Marie
Bought by
Vicory William M and Vicory Jeanne M
Current Estimated Value
Purchase Details
Closed on
Jun 25, 2009
Sold by
Damron Jerry L and Damron Heather M
Bought by
Vicory William M and Vicory Jeanne Marie
Home Financials for this Owner
Home Financials are based on the most recent Mortgage that was taken out on this home.
Original Mortgage
$50,000
Outstanding Balance
$32,534
Interest Rate
5.25%
Mortgage Type
New Conventional
Estimated Equity
$1,061,374
Purchase Details
Closed on
Mar 14, 2008
Sold by
Shea Homes Lp
Bought by
Damron Jerry L and Damron Heather M
Home Financials for this Owner
Home Financials are based on the most recent Mortgage that was taken out on this home.
Original Mortgage
$394,000
Interest Rate
5.72%
Mortgage Type
Purchase Money Mortgage
Create a Home Valuation Report for This Property
The Home Valuation Report is an in-depth analysis detailing your home's value as well as a comparison with similar homes in the area
Home Values in the Area
Average Home Value in this Area
Purchase History
| Date | Buyer | Sale Price | Title Company |
|---|---|---|---|
| Vicory William M | -- | None Available | |
| Vicory William M | $465,000 | Fidelity National Title Co | |
| Damron Jerry L | $492,500 | First American Title Co |
Source: Public Records
Mortgage History
| Date | Status | Borrower | Loan Amount |
|---|---|---|---|
| Open | Vicory William M | $50,000 | |
| Previous Owner | Damron Jerry L | $394,000 |
Source: Public Records
Tax History Compared to Growth
Tax History
| Year | Tax Paid | Tax Assessment Tax Assessment Total Assessment is a certain percentage of the fair market value that is determined by local assessors to be the total taxable value of land and additions on the property. | Land | Improvement |
|---|---|---|---|---|
| 2025 | $2,377 | $238,219 | $103,571 | $134,648 |
| 2024 | $2,348 | $233,549 | $101,541 | $132,008 |
| 2023 | $2,348 | $228,970 | $99,550 | $129,420 |
| 2022 | $2,311 | $224,482 | $97,599 | $126,883 |
| 2021 | $2,306 | $220,082 | $95,686 | $124,396 |
| 2020 | $2,278 | $217,826 | $94,705 | $123,121 |
| 2019 | $2,263 | $213,556 | $92,849 | $120,707 |
| 2018 | $2,235 | $209,370 | $91,029 | $118,341 |
| 2017 | $2,191 | $205,266 | $89,245 | $116,021 |
| 2016 | $2,065 | $201,243 | $87,496 | $113,747 |
| 2015 | $2,034 | $198,221 | $86,182 | $112,039 |
| 2014 | $1,958 | $194,339 | $84,494 | $109,845 |
Source: Public Records
Map
Nearby Homes
- 961 Jacqueline Place
- 1783 Trilogy Pkwy
- 977 Jacqueline Place
- 1685 Louise Ln
- 1849 Eucalyptus Rd
- 1156 Spring Azure Way
- 1153 Spring Azure Way
- 1539 Vista Tesoro Place
- 1187 Swallowtail Way
- 1147 Vaquero Way
- 1160 Korey Ct
- 1441 Vicki Ln
- 867 Trail View Place
- 808 Albert Way
- 708 Albert Way
- 1175 Danielle Ct
- 1084 Emma Ln
- 1455 Via Vista
- 1441 Via Vista
- 1354 Trail View Place
- 953 Jason Ct
- 1754 Waterview Place
- 1748 Waterview Place
- 959 Jason Ct
- 940 Sophie Ct
- 1760 Waterview Place
- 946 Sophie Ct
- 948 Jason Ct
- 954 Jason Ct
- 952 Sophie Ct
- 1766 Waterview Place
- 1742 Waterview Place
- 958 Sophie Ct
- 1772 Waterview Place
- 960 Jason Ct
- 1736 Waterview Place
- 966 Jason Ct
- 1783 Waterview Place
- 1778 Waterview Place
- 964 Sophie Ct