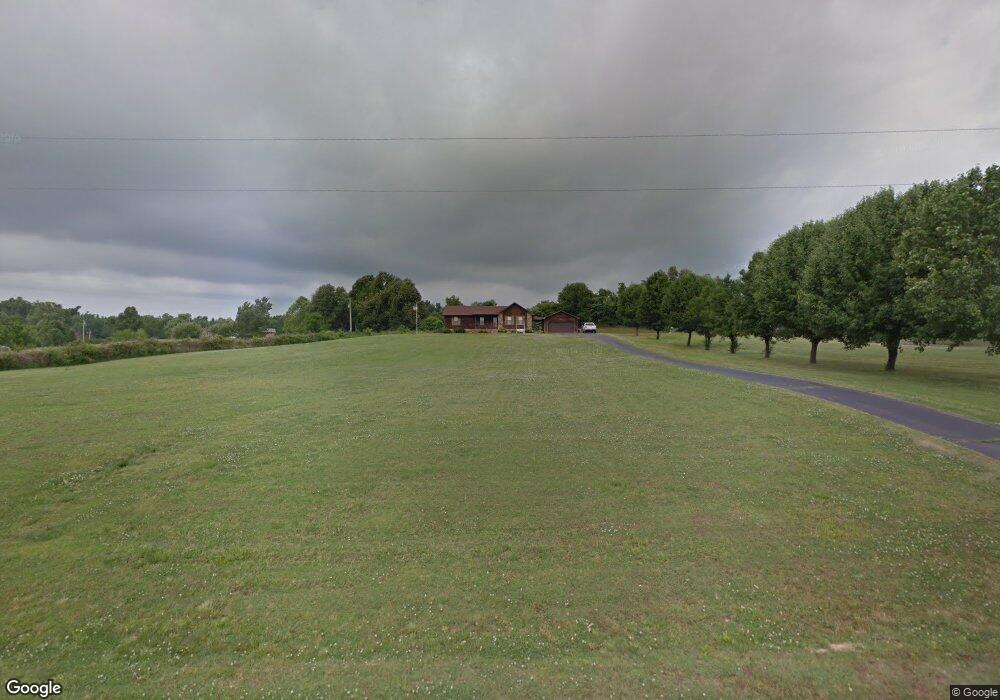
947 John Inman Rd Union City, TN 38261
Estimated Value: $190,000 - $283,000
--
Bed
2
Baths
2,000
Sq Ft
$121/Sq Ft
Est. Value
About This Home
This home is located at 947 John Inman Rd, Union City, TN 38261 and is currently estimated at $241,192, approximately $120 per square foot. 947 John Inman Rd is a home located in Obion County.
Ownership History
Date
Name
Owned For
Owner Type
Purchase Details
Closed on
Jan 19, 2009
Sold by
York Clay M
Bought by
Taylor Mark A
Current Estimated Value
Purchase Details
Closed on
Aug 14, 2008
Sold by
York Clay M
Bought by
Gary Hurt
Purchase Details
Closed on
Aug 21, 2003
Sold by
Elvis Stewart
Bought by
York Clay M
Purchase Details
Closed on
Jun 13, 1997
Sold by
Jim Robertson
Bought by
Stewart Elvis R
Purchase Details
Closed on
Feb 16, 1988
Bought by
Robertson Jim and Robertson Susan
Create a Home Valuation Report for This Property
The Home Valuation Report is an in-depth analysis detailing your home's value as well as a comparison with similar homes in the area
Home Values in the Area
Average Home Value in this Area
Purchase History
| Date | Buyer | Sale Price | Title Company |
|---|---|---|---|
| Taylor Mark A | $103,000 | -- | |
| Gary Hurt | -- | -- | |
| York Clay M | $118,000 | -- | |
| Stewart Elvis R | $95,000 | -- | |
| Robertson Jim | $7,000 | -- |
Source: Public Records
Tax History Compared to Growth
Tax History
| Year | Tax Paid | Tax Assessment Tax Assessment Total Assessment is a certain percentage of the fair market value that is determined by local assessors to be the total taxable value of land and additions on the property. | Land | Improvement |
|---|---|---|---|---|
| 2024 | $737 | $53,400 | $5,675 | $47,725 |
| 2023 | $737 | $53,400 | $5,675 | $47,725 |
| 2022 | $640 | $33,700 | $5,700 | $28,000 |
| 2021 | $564 | $29,675 | $5,700 | $23,975 |
| 2020 | $564 | $29,675 | $5,700 | $23,975 |
| 2019 | $564 | $29,675 | $5,700 | $23,975 |
| 2018 | $565 | $29,675 | $5,700 | $23,975 |
| 2017 | $614 | $30,650 | $5,700 | $24,950 |
| 2016 | $614 | $30,650 | $5,700 | $24,950 |
| 2015 | $614 | $30,650 | $5,700 | $24,950 |
| 2014 | $614 | $30,650 | $5,700 | $24,950 |
Source: Public Records
Map
Nearby Homes
- Lot 11 Wynridge
- Lot 10 Wynridge
- 612 Wynridge Dr
- 1403 Lynn Place
- 608 Homestead Dr
- 614 Homestead Dr
- 622 Homestead Dr
- 713 Homestead Dr
- 533 Homestead Dr
- 525 Homestead Dr
- 523 Homestead Dr
- 619 Homestead Dr
- 129 Virginia Dr
- 1587 Troy Hickman Rd
- 138 Virginia Dr
- 0 Add Osburn Rd
- 121 Easley St Unit 125 Easley
- 307 N Maple St
- 1719 Martin Dr
- 207 Main St
- 963 John Inman Rd
- 770 Dogwood Trail
- 985 John Inman Rd
- Lot 6 John Inman Rd
- Lot 3 John Inman Rd
- 799 Dogwood Trail
- 997 John Inman Rd
- 756 Dogwood Trail
- 1017 John Inman Rd
- 757 Dogwood Trail
- 1047 John Inman Rd
- 928 John Inman Rd
- 753 Phebus Rd
- 791 Phebus Rd
- 834 John Inman Rd
- 813 Phebus Rd
- 831 Phebus Rd
- 829 Cambria Dr
- 797 John Inman Rd
- 711 Phebus Rd