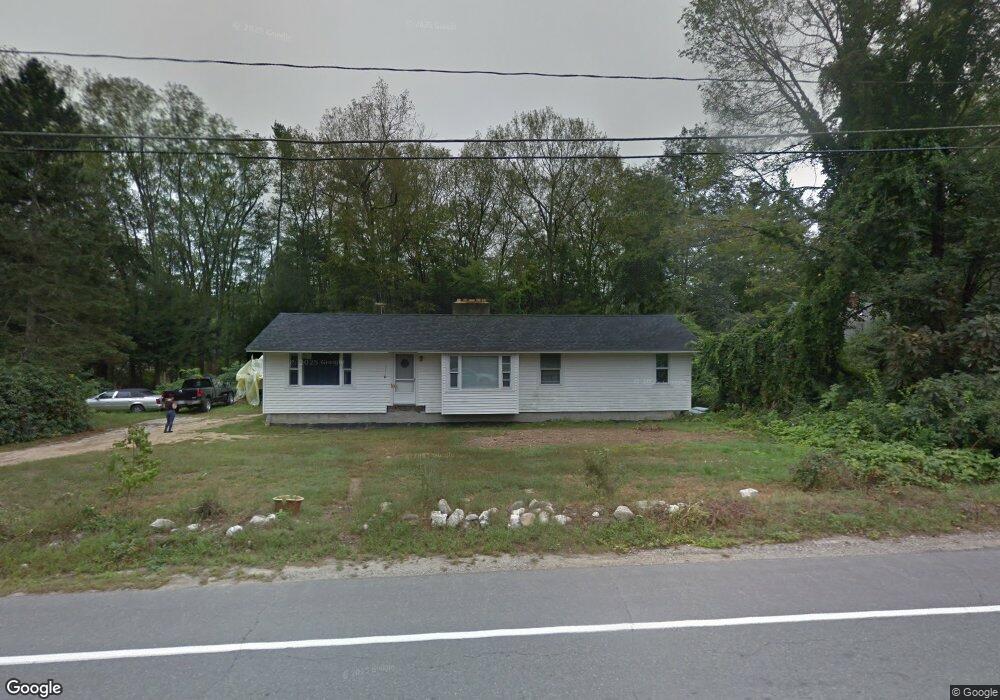
947 Main St Fremont, NH 03044
Estimated Value: $272,000 - $416,331
2
Beds
1
Bath
1,316
Sq Ft
$281/Sq Ft
Est. Value
About This Home
This home is located at 947 Main St, Fremont, NH 03044 and is currently estimated at $369,833, approximately $281 per square foot. 947 Main St is a home located in Rockingham County with nearby schools including Ellis School.
Ownership History
Date
Name
Owned For
Owner Type
Purchase Details
Closed on
May 22, 2018
Sold by
Lemay Mark
Bought by
Lemay Ashley
Current Estimated Value
Purchase Details
Closed on
May 6, 2011
Sold by
Fnma
Bought by
Lemay Mark
Purchase Details
Closed on
May 26, 2010
Sold by
Hinton James R and Fnma
Bought by
Federal National Mortgage Association
Purchase Details
Closed on
May 2, 2005
Sold by
Bonis Lila H Est
Bought by
Hinton James R and Bourassa Lynsie M
Home Financials for this Owner
Home Financials are based on the most recent Mortgage that was taken out on this home.
Original Mortgage
$200,000
Interest Rate
5.95%
Mortgage Type
Purchase Money Mortgage
Create a Home Valuation Report for This Property
The Home Valuation Report is an in-depth analysis detailing your home's value as well as a comparison with similar homes in the area
Home Values in the Area
Average Home Value in this Area
Purchase History
| Date | Buyer | Sale Price | Title Company |
|---|---|---|---|
| Lemay Ashley | -- | -- | |
| Lemay Mark | $85,000 | -- | |
| Federal National Mortgage Association | $158,600 | -- | |
| Hinton James R | $200,000 | -- |
Source: Public Records
Mortgage History
| Date | Status | Borrower | Loan Amount |
|---|---|---|---|
| Previous Owner | Hinton James R | $200,000 |
Source: Public Records
Tax History Compared to Growth
Tax History
| Year | Tax Paid | Tax Assessment Tax Assessment Total Assessment is a certain percentage of the fair market value that is determined by local assessors to be the total taxable value of land and additions on the property. | Land | Improvement |
|---|---|---|---|---|
| 2024 | $5,179 | $196,400 | $70,600 | $125,800 |
| 2023 | $4,633 | $196,400 | $70,600 | $125,800 |
| 2022 | $4,527 | $195,200 | $70,600 | $124,600 |
| 2021 | $4,357 | $195,200 | $70,600 | $124,600 |
| 2020 | $4,515 | $195,200 | $70,600 | $124,600 |
| 2019 | $5,887 | $132,900 | $48,400 | $84,500 |
| 2018 | $5,867 | $132,900 | $48,400 | $84,500 |
| 2017 | $3,879 | $132,900 | $48,400 | $84,500 |
| 2016 | $5,688 | $132,900 | $48,400 | $84,500 |
| 2015 | $3,854 | $132,900 | $48,400 | $84,500 |
| 2014 | $3,829 | $135,700 | $48,400 | $87,300 |
| 2013 | $3,869 | $135,700 | $48,400 | $87,300 |
Source: Public Records
Map
Nearby Homes
- 30 Tibbetts Rd
- 14 River Rd
- 17 Edgewater Dr Unit 26
- 13 Edgewater Dr Unit 24
- 18 Edgewater Dr Unit 33
- 19 Edgewater Dr Unit 27
- 25 Edgewater Dr
- 24 Edgewater Dr
- 15 Edgewater Dr
- 26 Edgewater Dr
- 23 Edgewater Dr Unit 29
- 16 Edgewater Dr Unit 34
- 11 Edgewater Dr Unit 23
- 14 Edgewater Dr Unit 31
- 8 Taylor Cir Unit 12
- Lot G Longview Place
- 9 Byrne Cir Unit 65
- 12 Hub Hollow Rd
- 24 Rim Rd
- 8 Stone Creek Dr