
Landlord's Agent in 2025
Joseph DeFilippo
Compass
(202) 341-2877
86 Total Sales
Estimated Value: $457,438 - $561,000
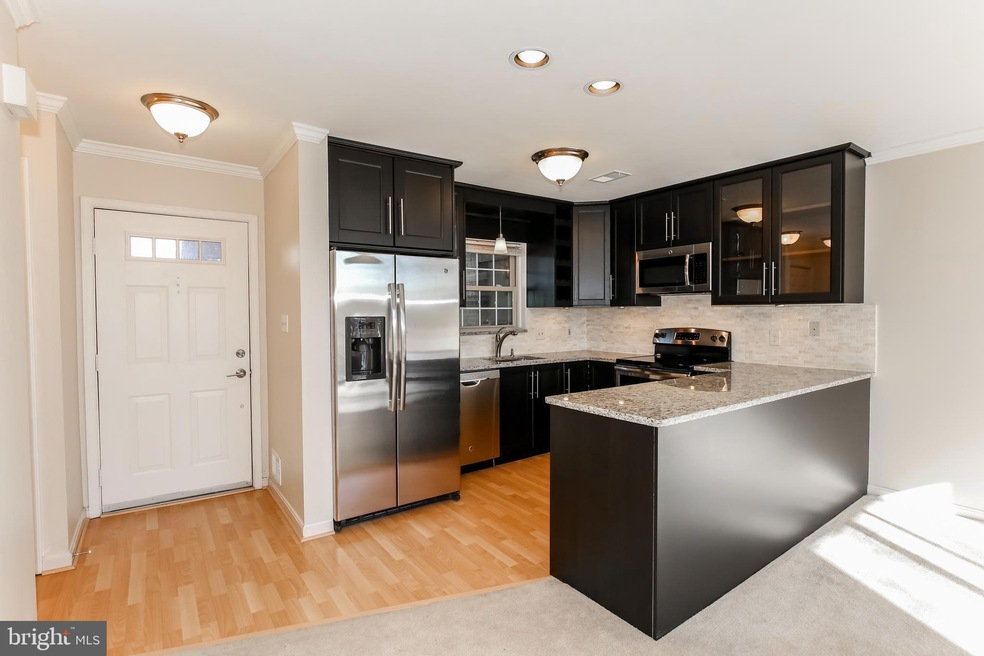
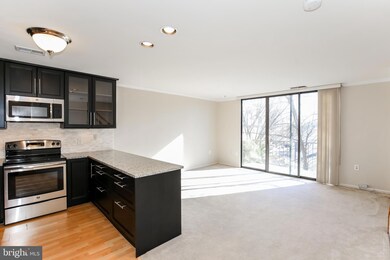
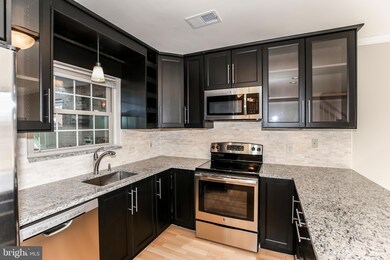
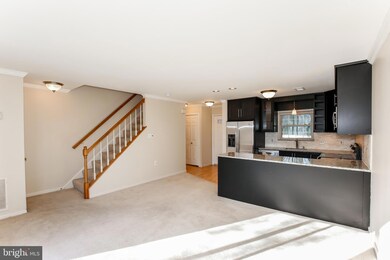
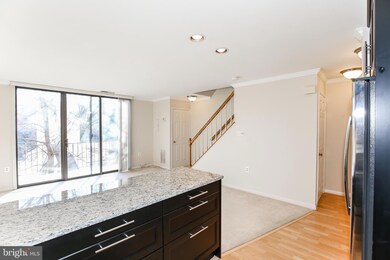
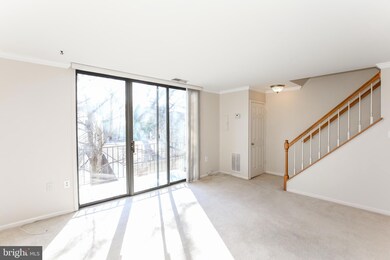
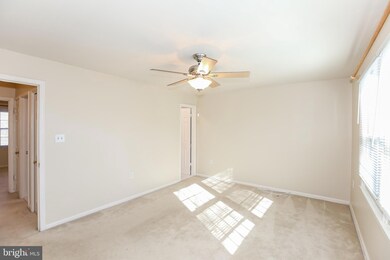
Bright and sunny town home in Columbia Court! Enjoy the gorgeous custom kitchen and marble bathrooms. First floor boasts open floor plan perfect for entertaining or just relax on the tranquil balcony. Second floor hosts two large bedrooms, two bathrooms, W/D, and spacious closets. Located on quiet dead end street with Towers Park (tennis courts and dog park) a few steps away. .5 mile walk to Giant, .25 mile drive to 395, National Landing, and more!
Last Renter's Agent
(301) 806-8871 carolstrasfeld@gmail.com Unrepresented Buyer Office
| Date | Buyer | Sale Price | Title Company |
|---|---|---|---|
| Casanova Jose R | $144,500 | -- | |
| Landry Helen P | $135,000 | -- |
| Date | Status | Borrower | Loan Amount |
|---|---|---|---|
| Open | Casanova Jose R | $140,150 | |
| Previous Owner | Landry Helen P | $128,250 |
| Date | Event | Price | List to Sale | Price per Sq Ft |
|---|---|---|---|---|
| 01/10/2025 01/10/25 | Rented | $2,600 | 0.0% | -- |
| 10/11/2024 10/11/24 | For Rent | $2,600 | 0.0% | -- |
| 03/18/2024 03/18/24 | Rented | $2,600 | 0.0% | -- |
| 02/28/2024 02/28/24 | For Rent | $2,600 | +13.1% | -- |
| 10/28/2019 10/28/19 | Rented | $2,299 | 0.0% | -- |
| 09/06/2019 09/06/19 | For Rent | $2,299 | +6.9% | -- |
| 04/13/2016 04/13/16 | Rented | $2,150 | -5.5% | -- |
| 04/12/2016 04/12/16 | Under Contract | -- | -- | -- |
| 01/14/2016 01/14/16 | For Rent | $2,275 | -- | -- |
| Year | Tax Paid | Tax Assessment Tax Assessment Total Assessment is a certain percentage of the fair market value that is determined by local assessors to be the total taxable value of land and additions on the property. | Land | Improvement |
|---|---|---|---|---|
| 2025 | $4,786 | $463,300 | $56,100 | $407,200 |
| 2024 | $4,786 | $463,300 | $56,100 | $407,200 |
| 2023 | $4,772 | $463,300 | $56,100 | $407,200 |
| 2022 | $4,391 | $426,300 | $56,100 | $370,200 |
| 2021 | $4,391 | $426,300 | $56,100 | $370,200 |
| 2020 | $4,093 | $398,900 | $38,700 | $360,200 |
| 2019 | $3,697 | $360,300 | $38,700 | $321,600 |
| 2018 | $3,625 | $360,300 | $38,700 | $321,600 |
| 2017 | $3,530 | $350,900 | $38,700 | $312,200 |
| 2016 | $3,417 | $344,800 | $38,700 | $306,100 |
| 2015 | $3,404 | $341,800 | $38,700 | $303,100 |
| 2014 | $3,057 | $306,900 | $38,700 | $268,200 |
Landlord's Agent in 2025
Joseph DeFilippo
Compass
(202) 341-2877
86 Total Sales
Tenant's Agent in 2025
Carol Strasfeld
Unrepresented Buyer Office
(301) 806-8871
8,653 Total Sales
G
Buyer's Agent in 2024
Genevieve Ciofani
KW Metro Center
(414) 916-7734
3 Total Sales
Source: Bright MLS
MLS Number: VAAR2049660
APN: 25-020-083
Disclaimer: Certain information contained herein is derived from information provided by parties other than Homes.com. All information provided is deemed reliable, but is not guaranteed to be accurate and should be independently verified.
![]() The data relating to real estate for sale on this website appears in part through the BRIGHT Internet Data Exchange program, a voluntary cooperative exchange of property listing data between licensed real estate brokerage firms, and is provided by BRIGHT through a licensing agreement.
The data relating to real estate for sale on this website appears in part through the BRIGHT Internet Data Exchange program, a voluntary cooperative exchange of property listing data between licensed real estate brokerage firms, and is provided by BRIGHT through a licensing agreement.
Listing information is from various brokers who participate in the Bright MLS IDX program and not all listings may be visible on the site.
The property information being provided on or through the website is for the personal, non-commercial use of consumers and such information may not be used for any purpose other than to identify prospective properties consumers may be interested in purchasing.
Some properties which appear for sale on the website may no longer be available because they are for instance, under contract, sold or are no longer being offered for sale.
Property information displayed is deemed reliable but is not guaranteed.
Copyright 2025 Bright MLS, Inc.