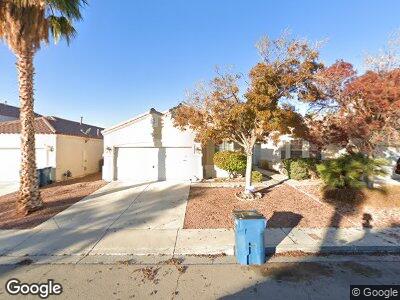
9473 Descending Creek St Las Vegas, NV 89123
Silverado Ranch NeighborhoodEstimated Value: $412,000 - $426,000
3
Beds
2
Baths
1,305
Sq Ft
$321/Sq Ft
Est. Value
About This Home
This home is located at 9473 Descending Creek St, Las Vegas, NV 89123 and is currently estimated at $418,327, approximately $320 per square foot. 9473 Descending Creek St is a home located in Clark County with nearby schools including John R. Hummel Elementary School, Charles Silvestri Junior High School, and Liberty High School.
Ownership History
Date
Name
Owned For
Owner Type
Purchase Details
Closed on
Mar 2, 2002
Sold by
Guise Richard Raymond
Bought by
Wilson Cynthia L
Current Estimated Value
Home Financials for this Owner
Home Financials are based on the most recent Mortgage that was taken out on this home.
Original Mortgage
$98,500
Interest Rate
6.8%
Purchase Details
Closed on
Feb 1, 2002
Sold by
Wilson Cynthia L
Bought by
Morgan Diane M
Home Financials for this Owner
Home Financials are based on the most recent Mortgage that was taken out on this home.
Original Mortgage
$98,500
Interest Rate
6.8%
Purchase Details
Closed on
Nov 13, 2000
Sold by
Trident Homes Of Nevada Inc
Bought by
Wilson Cynthia L
Home Financials for this Owner
Home Financials are based on the most recent Mortgage that was taken out on this home.
Original Mortgage
$114,615
Interest Rate
7.86%
Create a Home Valuation Report for This Property
The Home Valuation Report is an in-depth analysis detailing your home's value as well as a comparison with similar homes in the area
Home Values in the Area
Average Home Value in this Area
Purchase History
| Date | Buyer | Sale Price | Title Company |
|---|---|---|---|
| Wilson Cynthia L | $142,500 | Old Republic Title Company | |
| Morgan Diane M | $142,500 | Old Republic Title Company | |
| Wilson Cynthia L | $127,350 | Land Title |
Source: Public Records
Mortgage History
| Date | Status | Borrower | Loan Amount |
|---|---|---|---|
| Open | Morgan Diane M | $99,000 | |
| Closed | Morgan Diane M | $102,000 | |
| Closed | Morgan Diane M | $98,500 | |
| Previous Owner | Wilson Cynthia L | $114,615 |
Source: Public Records
Tax History Compared to Growth
Tax History
| Year | Tax Paid | Tax Assessment Tax Assessment Total Assessment is a certain percentage of the fair market value that is determined by local assessors to be the total taxable value of land and additions on the property. | Land | Improvement |
|---|---|---|---|---|
| 2025 | $1,501 | $96,529 | $39,550 | $56,979 |
| 2024 | $1,458 | $96,529 | $39,550 | $56,979 |
| 2023 | $1,458 | $86,965 | $33,250 | $53,715 |
| 2022 | $1,416 | $76,889 | $27,650 | $49,239 |
| 2021 | $1,375 | $72,610 | $25,900 | $46,710 |
| 2020 | $1,332 | $72,285 | $25,900 | $46,385 |
| 2019 | $1,293 | $65,996 | $20,300 | $45,696 |
| 2018 | $1,255 | $61,521 | $17,500 | $44,021 |
| 2017 | $1,759 | $59,983 | $15,400 | $44,583 |
| 2016 | $1,190 | $55,690 | $11,900 | $43,790 |
| 2015 | $1,186 | $45,606 | $9,450 | $36,156 |
| 2014 | $1,152 | $38,099 | $7,000 | $31,099 |
Source: Public Records
Map
Nearby Homes
- 152 Lotus Vale Ave
- 9509 Swiss Stone Ct
- 103 Trout Creek Ct
- 9604 Vital Crest St
- 9604 Flying Eagle Ln
- 9535 Golden Scots Ct
- 130 Twin Towers Ave
- 70 Belle Essence Ave
- 50 Belle La Blanc Ave
- 258 Spring River Ave
- 71 E Agate Ave Unit 207
- 9215 Penn Station St
- 51 Belle Point Ave
- 59 E Agate Ave Unit 406
- 59 E Agate Ave Unit 306
- 75 E Agate Ave Unit 206
- 59 Belle Maison Ave
- 56 Belle Ridge Ave
- 55 E Agate Ave Unit 202
- 55 E Agate Ave Unit 309
- 9473 Descending Creek St
- 9479 Descending Creek St
- 9467 Descending Creek St
- 9485 Descending Creek St
- 9461 Descending Creek St
- 9484 Lake Creek St
- 9476 Lake Creek St
- 9455 Descending Creek St Unit 2
- 9491 Descending Creek St
- 9488 Lake Creek St
- 9468 Lake Creek St
- 9474 Descending Creek St
- 9468 Descending Creek St
- 9449 Descending Creek St
- 9480 Descending Creek St
- 9460 Lake Creek St
- 9462 Descending Creek St
- 9486 Descending Creek St
- 143 Arbor Creek Ct
- 9456 Descending Creek St