9479 Twin Oaks Place Rancho Cucamonga, CA 91730
Estimated Value: $877,000 - $939,023
3
Beds
3
Baths
3,147
Sq Ft
$289/Sq Ft
Est. Value
About This Home
This home is located at 9479 Twin Oaks Place, Rancho Cucamonga, CA 91730 and is currently estimated at $908,506, approximately $288 per square foot. 9479 Twin Oaks Place is a home located in San Bernardino County with nearby schools including Ontario Center School, Rancho Cucamonga Middle, and Colony High.
Ownership History
Date
Name
Owned For
Owner Type
Purchase Details
Closed on
Jun 11, 2019
Sold by
Southorn Peter and Southorn Darling Rachel
Bought by
Southorn Peter R and Southorn Darling Rashel
Current Estimated Value
Purchase Details
Closed on
Apr 28, 2012
Sold by
Southorn Peter and Southorn Rachel D
Bought by
Southorn Peter and Southorn Rachel D
Home Financials for this Owner
Home Financials are based on the most recent Mortgage that was taken out on this home.
Original Mortgage
$225,000
Outstanding Balance
$92,151
Interest Rate
3.34%
Mortgage Type
New Conventional
Estimated Equity
$816,355
Purchase Details
Closed on
Apr 22, 2002
Sold by
Centex Homes
Bought by
Southorn Peter and Hatton Rachel D
Home Financials for this Owner
Home Financials are based on the most recent Mortgage that was taken out on this home.
Original Mortgage
$245,592
Interest Rate
7.08%
Create a Home Valuation Report for This Property
The Home Valuation Report is an in-depth analysis detailing your home's value as well as a comparison with similar homes in the area
Home Values in the Area
Average Home Value in this Area
Purchase History
| Date | Buyer | Sale Price | Title Company |
|---|---|---|---|
| Southorn Peter R | -- | None Available | |
| Southorn Peter | -- | Integrated Title Inc | |
| Southorn Peter | $307,000 | Commerce Title |
Source: Public Records
Mortgage History
| Date | Status | Borrower | Loan Amount |
|---|---|---|---|
| Open | Southorn Peter | $225,000 | |
| Closed | Southorn Peter | $245,592 |
Source: Public Records
Tax History Compared to Growth
Tax History
| Year | Tax Paid | Tax Assessment Tax Assessment Total Assessment is a certain percentage of the fair market value that is determined by local assessors to be the total taxable value of land and additions on the property. | Land | Improvement |
|---|---|---|---|---|
| 2025 | $6,244 | $488,793 | $132,958 | $355,835 |
| 2024 | $6,244 | $479,209 | $130,351 | $348,858 |
| 2023 | $6,106 | $469,813 | $127,795 | $342,018 |
| 2022 | $5,994 | $460,601 | $125,289 | $335,312 |
| 2021 | $5,930 | $451,569 | $122,832 | $328,737 |
| 2020 | $5,823 | $446,939 | $121,573 | $325,366 |
| 2019 | $5,776 | $438,175 | $119,189 | $318,986 |
| 2018 | $5,639 | $429,583 | $116,852 | $312,731 |
| 2017 | $5,136 | $390,767 | $114,561 | $276,206 |
| 2016 | $5,062 | $383,105 | $112,315 | $270,790 |
| 2015 | $5,015 | $377,350 | $110,628 | $266,722 |
| 2014 | $4,875 | $369,958 | $108,461 | $261,497 |
Source: Public Records
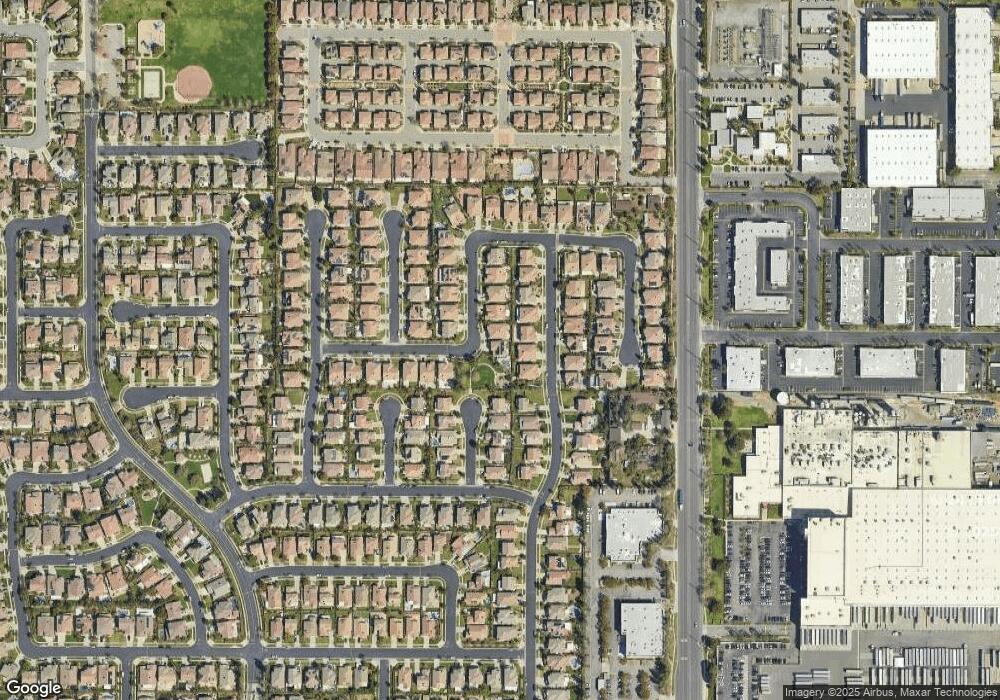
Map
Nearby Homes
- 9593 Brook Dr
- 9427 Sun Meadow Ct
- 9523 Sunglow Ct
- 9357 Culinary Place
- 9550 Springbrook Ct
- 9403 Old Post Dr
- 9175 Jadeite Ave
- 9330 Alderwood Dr
- 2139 E 4th St #244 St Unit 244
- 2139 E 4th St Unit 230
- 2139 E 4th St Unit 176
- 2139 E 4th St Unit 13
- 2139 E 4th St Unit 135
- 2139 E 4th St Unit 244
- 2139 E 4th St Unit 39
- 2139 E 4th St Unit 142
- 1044 N Turner Ave Unit 207
- 2927 E Via Terrano
- 2008 E 5th St
- 1120 N Solano Privado Unit A
- 9471 Twin Oaks Place
- 9482 Cedar Glen Place
- 9472 Cedar Glen Place
- 9488 Cedar Glen Place
- 9461 Twin Oaks Place
- 9458 Cedar Glen Place
- 9505 Falling Leaf Ct
- 9470 Twin Oaks Place
- 9506 Cedar Glen Ct
- 9581 Pinewood Dr
- 9455 Twin Oaks Place
- 9454 Cedar Glen Place
- 9464 Twin Oaks Place
- 9515 Falling Leaf Ct
- 9504 Falling Leaf Ct
- 9475 Cedar Glen Place
- 9573 Pinewood Dr
- 9489 Cedar Glen Place
- 9514 Cedar Glen Ct
- 9443 Twin Oaks Place