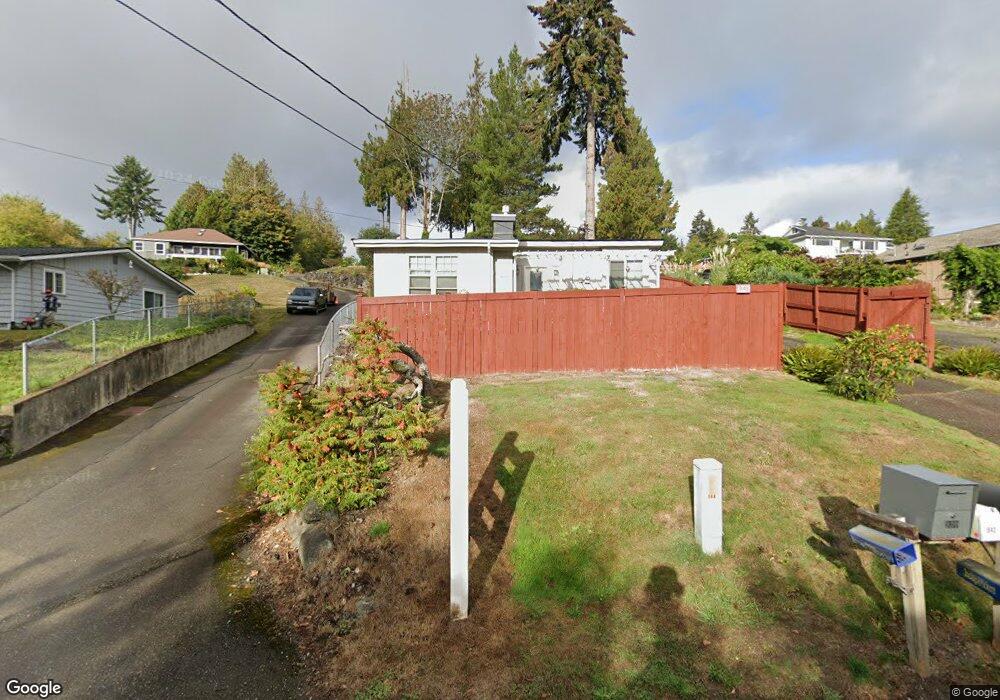
948 Colchester Dr E Port Orchard, WA 98366
Manchester NeighborhoodEstimated Value: $408,609 - $454,000
2
Beds
1
Bath
976
Sq Ft
$449/Sq Ft
Est. Value
About This Home
This home is located at 948 Colchester Dr E, Port Orchard, WA 98366 and is currently estimated at $438,652, approximately $449 per square foot. 948 Colchester Dr E is a home located in Kitsap County with nearby schools including Manchester Elementary School, John Sedgwick Middle School, and South Kitsap High School.
Ownership History
Date
Name
Owned For
Owner Type
Purchase Details
Closed on
Oct 20, 2006
Sold by
Bady Shirley Ann
Bought by
Bady Michael
Current Estimated Value
Purchase Details
Closed on
Jan 28, 2003
Sold by
Bady Michael L and Bady Shirley Ann
Bought by
Bady Shirley Ann
Home Financials for this Owner
Home Financials are based on the most recent Mortgage that was taken out on this home.
Original Mortgage
$92,000
Interest Rate
8.99%
Mortgage Type
Purchase Money Mortgage
Purchase Details
Closed on
Nov 22, 1996
Sold by
Carlson Vicki and Butterfield Vicki S
Bought by
Bady Michael L and Bady Shirley Ann
Home Financials for this Owner
Home Financials are based on the most recent Mortgage that was taken out on this home.
Original Mortgage
$69,937
Interest Rate
7.86%
Mortgage Type
VA
Create a Home Valuation Report for This Property
The Home Valuation Report is an in-depth analysis detailing your home's value as well as a comparison with similar homes in the area
Home Values in the Area
Average Home Value in this Area
Purchase History
| Date | Buyer | Sale Price | Title Company |
|---|---|---|---|
| Bady Michael | -- | Land Title Company | |
| Bady Shirley Ann | -- | Land Title Company | |
| Bady Michael L | -- | Charter Title Corp |
Source: Public Records
Mortgage History
| Date | Status | Borrower | Loan Amount |
|---|---|---|---|
| Previous Owner | Bady Shirley Ann | $92,000 | |
| Previous Owner | Bady Michael L | $69,937 |
Source: Public Records
Tax History Compared to Growth
Tax History
| Year | Tax Paid | Tax Assessment Tax Assessment Total Assessment is a certain percentage of the fair market value that is determined by local assessors to be the total taxable value of land and additions on the property. | Land | Improvement |
|---|---|---|---|---|
| 2026 | $631 | $374,840 | $151,970 | $222,870 |
| 2025 | $631 | $374,840 | $151,970 | $222,870 |
| 2024 | $617 | $374,840 | $151,970 | $222,870 |
| 2023 | $1,465 | $374,840 | $151,970 | $222,870 |
| 2022 | $3,020 | $299,670 | $121,370 | $178,300 |
| 2021 | $2,784 | $261,080 | $105,540 | $155,540 |
| 2020 | $2,044 | $183,720 | $59,650 | $124,070 |
| 2019 | $1,763 | $173,720 | $56,390 | $117,330 |
| 2018 | $1,845 | $138,190 | $48,930 | $89,260 |
| 2017 | $1,545 | $138,190 | $48,930 | $89,260 |
| 2016 | $1,521 | $124,640 | $46,600 | $78,040 |
| 2015 | $1,473 | $122,390 | $46,600 | $75,790 |
| 2014 | -- | $119,340 | $48,050 | $71,290 |
| 2013 | -- | $119,340 | $48,050 | $71,290 |
Source: Public Records
Map
Nearby Homes
- 8154 E Seaview Dr
- 8185 E Seaview Dr
- 8151 E Seaview Dr
- 1083 Puget Dr E
- 8259 SE O'Farrell Ln
- 1630 & 1632 Colchester Dr E
- 7560 E Harrison St
- 1381 Alaska Ave SE
- 7275 E Harrison St
- 7166 E Fillmore St
- 2372 Valley Ave E
- 7104 SE Kansas St
- 6717 E Polk Ave
- 1023 Nebraska St SE
- 8095 E Daniels Loop
- 5 Lots Lilypad Place E
- 7940 Beach Dr E
- 7085 SE Legrand St
- 1738 Lilypad Place E
- 2451 Mcgregor Dr SE
- 906 Colchester Dr E
- 952 Colchester Dr E
- 990 Colchester Dr E
- 942 Colchester Dr E
- 889 Colchester Dr E
- 912 Colchester Dr E
- 912 Colchester Dr SE
- 899 Colchester Dr E
- 1030 Colchester Dr E
- 8248 E Seaview Dr
- 943 Colchester Dr E
- 855 Colchester Dr E
- 877 Colchester Dr E
- 8356 E Pheasant Hill Ln
- 835 Colchester Dr E
- 53 Colchester Dr SE
- 945 Colchester Dr E
- 8325 E Pheasant Hill Ln
- 8194 E Seaview Dr
- 807 Colchester Dr E