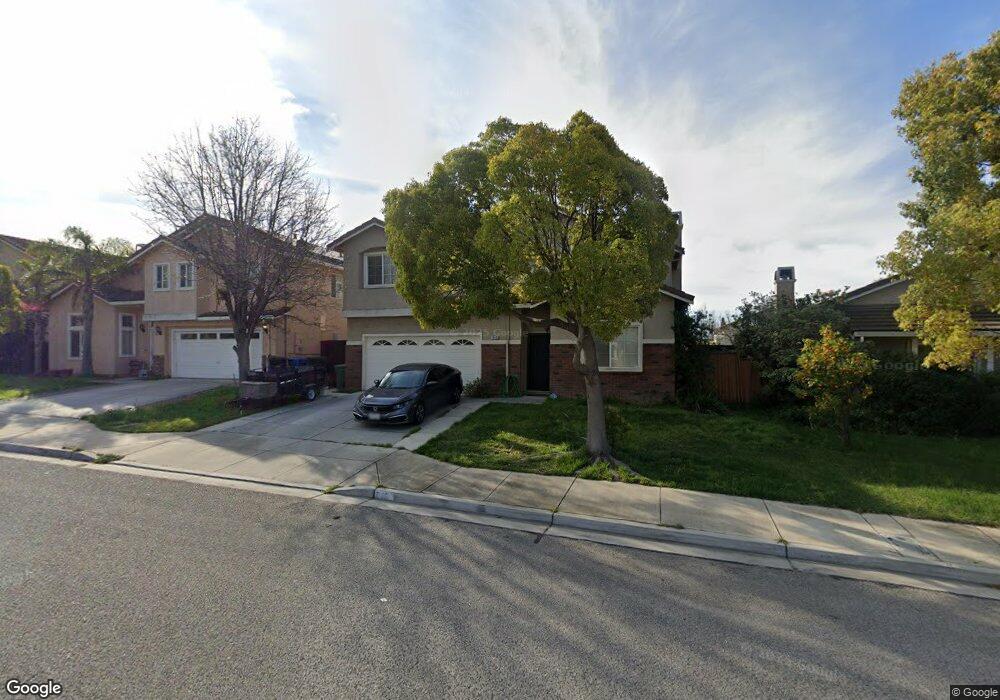
948 San Miguel Soledad, CA 93960
Estimated Value: $766,149 - $814,000
6
Beds
3
Baths
2,637
Sq Ft
$301/Sq Ft
Est. Value
About This Home
This home is located at 948 San Miguel, Soledad, CA 93960 and is currently estimated at $795,037, approximately $301 per square foot. 948 San Miguel is a home located in Monterey County with nearby schools including Jack Franscioni Elementary School, Main Street Middle School, and Soledad High School.
Ownership History
Date
Name
Owned For
Owner Type
Purchase Details
Closed on
Feb 24, 2009
Sold by
Deutsche Bank National Trust Company
Bought by
Safi Abdul Aziz and Safi Roshana
Current Estimated Value
Home Financials for this Owner
Home Financials are based on the most recent Mortgage that was taken out on this home.
Original Mortgage
$270,019
Outstanding Balance
$170,783
Interest Rate
5.03%
Mortgage Type
FHA
Estimated Equity
$624,254
Purchase Details
Closed on
Aug 12, 2008
Sold by
Blaha Paul and Blaha Kimberly K
Bought by
Deutsche Bank National Trust Co and Downey 2005-Ar5
Purchase Details
Closed on
Jul 24, 2003
Sold by
First American Title Co
Bought by
Blaha Paul and Blaha Kimberly K
Home Financials for this Owner
Home Financials are based on the most recent Mortgage that was taken out on this home.
Original Mortgage
$346,547
Interest Rate
5.15%
Mortgage Type
Purchase Money Mortgage
Create a Home Valuation Report for This Property
The Home Valuation Report is an in-depth analysis detailing your home's value as well as a comparison with similar homes in the area
Home Values in the Area
Average Home Value in this Area
Purchase History
| Date | Buyer | Sale Price | Title Company |
|---|---|---|---|
| Safi Abdul Aziz | $275,000 | Lawyers Title | |
| Deutsche Bank National Trust Co | $445,084 | None Available | |
| Blaha Paul | $365,000 | First American Title |
Source: Public Records
Mortgage History
| Date | Status | Borrower | Loan Amount |
|---|---|---|---|
| Open | Safi Abdul Aziz | $270,019 | |
| Previous Owner | Blaha Paul | $346,547 |
Source: Public Records
Tax History
| Year | Tax Paid | Tax Assessment Tax Assessment Total Assessment is a certain percentage of the fair market value that is determined by local assessors to be the total taxable value of land and additions on the property. | Land | Improvement |
|---|---|---|---|---|
| 2025 | $6,017 | $354,120 | $64,380 | $289,740 |
| 2024 | $6,017 | $347,177 | $63,118 | $284,059 |
| 2023 | $5,586 | $340,371 | $61,881 | $278,490 |
| 2022 | $5,626 | $333,698 | $60,668 | $273,030 |
| 2021 | $5,447 | $327,156 | $59,479 | $267,677 |
| 2020 | $5,359 | $323,803 | $58,870 | $264,933 |
| 2019 | $5,245 | $317,455 | $57,716 | $259,739 |
| 2018 | $5,090 | $311,232 | $56,585 | $254,647 |
| 2017 | $4,897 | $305,130 | $55,476 | $249,654 |
| 2016 | $4,603 | $299,148 | $54,389 | $244,759 |
| 2015 | -- | $294,656 | $53,573 | $241,083 |
| 2014 | -- | $288,885 | $52,524 | $236,361 |
Source: Public Records
Map
Nearby Homes
- 965 Las Flores St
- 704 Gabilan Dr
- 570 Tankersley St
- 509 Davalos St
- 638 Robledo Dr
- 836 Vasquez Dr
- 35095 Metz Rd
- 665 Molera Ave
- 1231 Carmelo
- 1253 La Paz Ct
- 449 Sage Ct
- 604 Gardenia Place
- 1117 Palm Ave
- 615 Monterey St
- 715 Skinner St
- 31102 Camphora Gloria Rd
- 33900 Fabry Rd
- 35700 Eagle Ridge
- 36527 Metz Rd
- 31462 El Camino Real
- 940 San Miguel
- 956 San Miguel
- 869 Las Flores St
- 964 San Miguel
- 861 Las Flores St
- 877 Las Flores St
- 932 San Miguel
- 885 Las Flores St
- 853 Las Flores St
- 953 San Miguel
- 972 San Miguel
- 945 San Miguel
- 961 San Miguel
- 893 Las Flores St
- 937 San Miguel
- 969 San Miguel
- 980 San Miguel
- 901 Las Flores St
- 839 Toledo St
- 872 Las Flores St
Your Personal Tour Guide
Ask me questions while you tour the home.