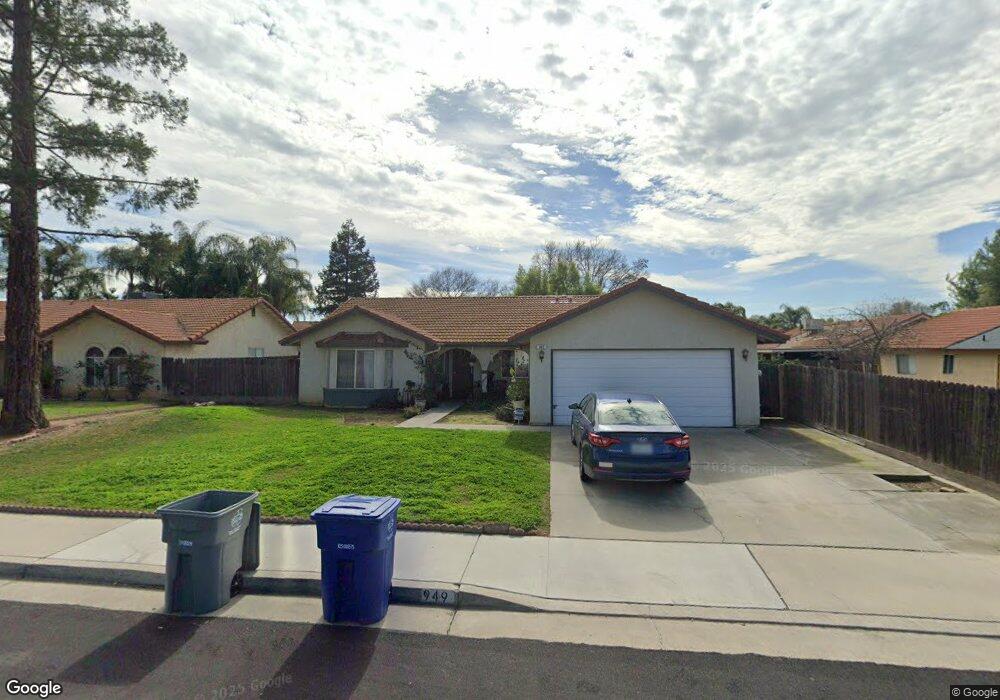
949 3rd St Sanger, CA 93657
Estimated Value: $338,000 - $381,000
4
Beds
2
Baths
1,554
Sq Ft
$227/Sq Ft
Est. Value
About This Home
This home is located at 949 3rd St, Sanger, CA 93657 and is currently estimated at $353,476, approximately $227 per square foot. 949 3rd St is a home located in Fresno County with nearby schools including Wilson Elementary School, Washington Academic Middle School, and Sanger High School.
Ownership History
Date
Name
Owned For
Owner Type
Purchase Details
Closed on
Aug 19, 2014
Sold by
Fiserv Iss & Co
Bought by
Pensco Trust Company
Current Estimated Value
Purchase Details
Closed on
Mar 3, 2011
Sold by
Sandoval Olivia Pinedo and Valencia Jesus Javier
Bought by
Fiserv Iss & Co
Purchase Details
Closed on
Jul 21, 2005
Sold by
Housing Authority Of The City Of Fresno
Bought by
Sandoval Olivia Pinedo and Valencia Jesus Javier
Home Financials for this Owner
Home Financials are based on the most recent Mortgage that was taken out on this home.
Original Mortgage
$113,500
Interest Rate
5.46%
Mortgage Type
Credit Line Revolving
Purchase Details
Closed on
Mar 15, 1995
Sold by
Esquivel Mario and Esquivel Lisaann
Bought by
Housing Authority Of Fresno County
Create a Home Valuation Report for This Property
The Home Valuation Report is an in-depth analysis detailing your home's value as well as a comparison with similar homes in the area
Home Values in the Area
Average Home Value in this Area
Purchase History
| Date | Buyer | Sale Price | Title Company |
|---|---|---|---|
| Pensco Trust Company | -- | None Available | |
| Fiserv Iss & Co | $98,500 | None Available | |
| Sandoval Olivia Pinedo | $99,000 | Stewart Title Of Fresno Coun | |
| Housing Authority Of Fresno County | -- | Central Title Company |
Source: Public Records
Mortgage History
| Date | Status | Borrower | Loan Amount |
|---|---|---|---|
| Previous Owner | Sandoval Olivia Pinedo | $113,500 |
Source: Public Records
Tax History
| Year | Tax Paid | Tax Assessment Tax Assessment Total Assessment is a certain percentage of the fair market value that is determined by local assessors to be the total taxable value of land and additions on the property. | Land | Improvement |
|---|---|---|---|---|
| 2025 | $1,721 | $134,510 | $32,023 | $102,487 |
| 2023 | $1,612 | $129,289 | $30,781 | $98,508 |
| 2022 | $1,588 | $126,755 | $30,178 | $96,577 |
| 2021 | $1,576 | $124,271 | $29,587 | $94,684 |
| 2020 | $1,530 | $122,998 | $29,284 | $93,714 |
| 2019 | $1,499 | $120,587 | $28,710 | $91,877 |
| 2018 | $1,437 | $118,224 | $28,148 | $90,076 |
| 2017 | $1,413 | $115,907 | $27,597 | $88,310 |
| 2016 | $1,329 | $113,635 | $27,056 | $86,579 |
| 2015 | $1,340 | $111,929 | $26,650 | $85,279 |
| 2014 | $1,322 | $109,737 | $26,128 | $83,609 |
Source: Public Records
Map
Nearby Homes
Your Personal Tour Guide
Ask me questions while you tour the home.