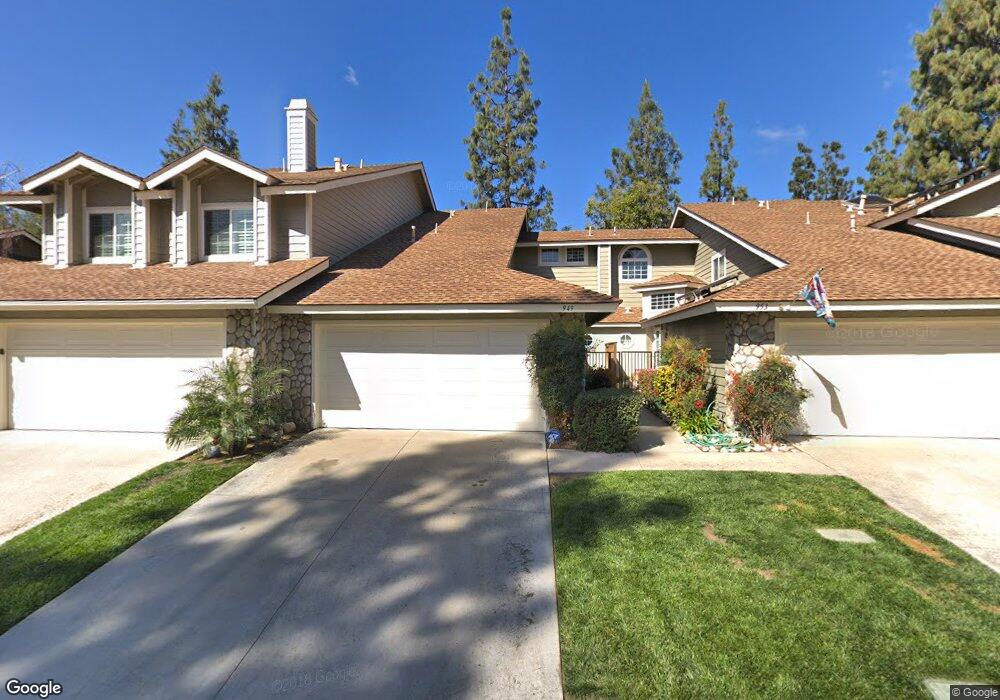
949 Auburn Rd San Dimas, CA 91773
Estimated Value: $662,199 - $774,000
2
Beds
3
Baths
1,424
Sq Ft
$493/Sq Ft
Est. Value
About This Home
This home is located at 949 Auburn Rd, San Dimas, CA 91773 and is currently estimated at $701,800, approximately $492 per square foot. 949 Auburn Rd is a home located in Los Angeles County with nearby schools including Allen Avenue Elementary School, Ramona Middle School, and Bonita High School.
Ownership History
Date
Name
Owned For
Owner Type
Purchase Details
Closed on
Nov 17, 2020
Sold by
Miller Brittany N and Higgins Brittany N
Bought by
Higgins Evan and Higgins Brittany N
Current Estimated Value
Home Financials for this Owner
Home Financials are based on the most recent Mortgage that was taken out on this home.
Original Mortgage
$239,000
Outstanding Balance
$212,291
Interest Rate
2.7%
Mortgage Type
New Conventional
Estimated Equity
$489,509
Purchase Details
Closed on
Nov 14, 2008
Sold by
Johns Lynne Louise and The Lynne Louise Johns 2004 Li
Bought by
Miller Brittany N
Home Financials for this Owner
Home Financials are based on the most recent Mortgage that was taken out on this home.
Original Mortgage
$280,000
Interest Rate
6.47%
Mortgage Type
Purchase Money Mortgage
Purchase Details
Closed on
Jun 24, 2004
Sold by
Johns Lynne Louise
Bought by
Johns Lynne Louise and Lynne Louise Johns 2004 Living Trust
Purchase Details
Closed on
Jul 30, 1996
Sold by
Coooper Carol K
Bought by
Johns Lynne
Home Financials for this Owner
Home Financials are based on the most recent Mortgage that was taken out on this home.
Original Mortgage
$115,600
Interest Rate
8.23%
Create a Home Valuation Report for This Property
The Home Valuation Report is an in-depth analysis detailing your home's value as well as a comparison with similar homes in the area
Home Values in the Area
Average Home Value in this Area
Purchase History
| Date | Buyer | Sale Price | Title Company |
|---|---|---|---|
| Higgins Evan | -- | North American Title | |
| Miller Brittany N | $350,000 | North American Title Company | |
| Johns Lynne Louise | -- | -- | |
| Johns Lynne | $144,500 | -- |
Source: Public Records
Mortgage History
| Date | Status | Borrower | Loan Amount |
|---|---|---|---|
| Open | Higgins Evan | $239,000 | |
| Previous Owner | Miller Brittany N | $280,000 | |
| Previous Owner | Johns Lynne | $115,600 |
Source: Public Records
Tax History Compared to Growth
Tax History
| Year | Tax Paid | Tax Assessment Tax Assessment Total Assessment is a certain percentage of the fair market value that is determined by local assessors to be the total taxable value of land and additions on the property. | Land | Improvement |
|---|---|---|---|---|
| 2025 | $5,509 | $450,697 | $176,285 | $274,412 |
| 2024 | $5,509 | $441,861 | $172,829 | $269,032 |
| 2023 | $5,386 | $433,198 | $169,441 | $263,757 |
| 2022 | $5,296 | $424,705 | $166,119 | $258,586 |
| 2021 | $5,192 | $416,378 | $162,862 | $253,516 |
| 2020 | $5,042 | $412,110 | $161,193 | $250,917 |
| 2019 | $5,012 | $404,031 | $158,033 | $245,998 |
| 2018 | $4,780 | $396,110 | $154,935 | $241,175 |
| 2016 | $4,597 | $380,731 | $148,920 | $231,811 |
| 2015 | $4,273 | $348,000 | $136,000 | $212,000 |
| 2014 | $3,923 | $318,000 | $124,000 | $194,000 |
Source: Public Records
Map
Nearby Homes
- 953 Alleghany Cir
- 629 Calaveras Rd
- 562 E Allen Ave
- 750 N Northcape Ave
- 1136 Cherokee Ct
- 555 Canyon Hill Rd
- 422 E Payson St
- 761 Fordland Ave
- 4575 Ramona Ave Unit 16
- 4545 Ramona Ave Unit 9
- 4565 Ramona Ave Unit 4
- 610 E Payson St
- 727 Glenlea St
- 237 Maverick Dr
- 0 Dallas Rd Unit WS25141209
- 208 E 3rd St
- 1287 Whisperglen Ln
- 2737 Pattiglen Ave
- 3537 Damien Ave
- 1255 Bonnie Glen Ln