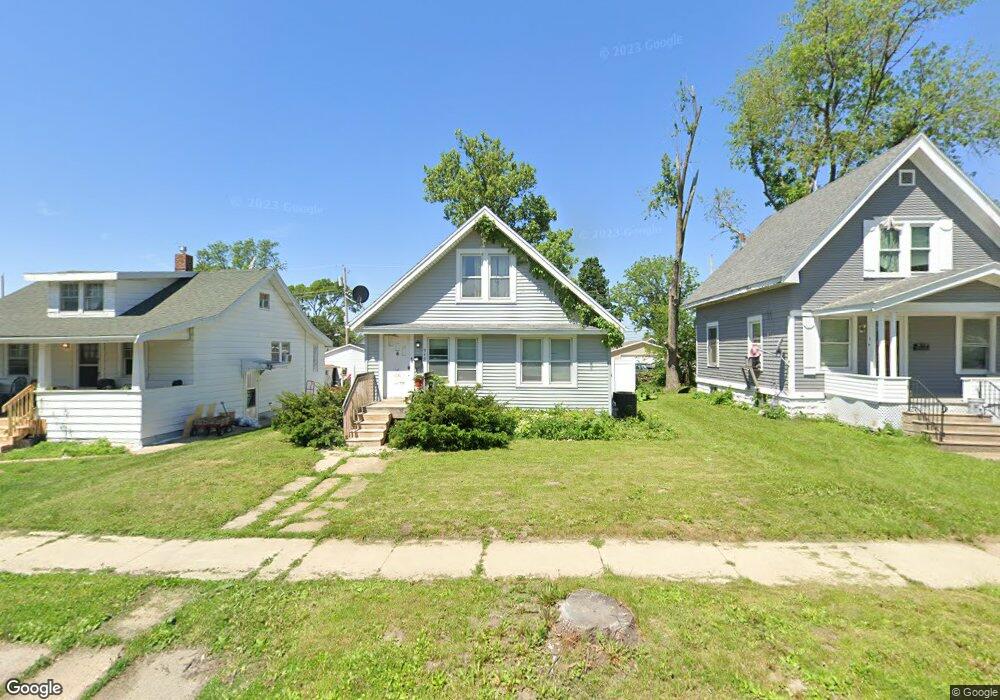
949 Center Point Rd NE Cedar Rapids, IA 52402
Mound View NeighborhoodEstimated Value: $106,000 - $132,000
2
Beds
2
Baths
794
Sq Ft
$149/Sq Ft
Est. Value
About This Home
This home is located at 949 Center Point Rd NE, Cedar Rapids, IA 52402 and is currently estimated at $117,934, approximately $148 per square foot. 949 Center Point Rd NE is a home located in Linn County with nearby schools including Garfield Elementary School, Franklin Middle School, and George Washington High School.
Ownership History
Date
Name
Owned For
Owner Type
Purchase Details
Closed on
Jan 7, 2005
Sold by
Fanning Joseph W and Fanning Cristina A
Bought by
Pohlpeter Paula M
Current Estimated Value
Home Financials for this Owner
Home Financials are based on the most recent Mortgage that was taken out on this home.
Original Mortgage
$75,650
Outstanding Balance
$37,561
Interest Rate
5.5%
Mortgage Type
Unknown
Estimated Equity
$80,373
Purchase Details
Closed on
Jul 16, 2003
Sold by
Schweitzer Irma I
Bought by
Fanning Joseph W and Fanning Cristina A
Home Financials for this Owner
Home Financials are based on the most recent Mortgage that was taken out on this home.
Original Mortgage
$67,521
Interest Rate
5.37%
Mortgage Type
Unknown
Create a Home Valuation Report for This Property
The Home Valuation Report is an in-depth analysis detailing your home's value as well as a comparison with similar homes in the area
Home Values in the Area
Average Home Value in this Area
Purchase History
| Date | Buyer | Sale Price | Title Company |
|---|---|---|---|
| Pohlpeter Paula M | $88,500 | -- | |
| Fanning Joseph W | $76,500 | -- |
Source: Public Records
Mortgage History
| Date | Status | Borrower | Loan Amount |
|---|---|---|---|
| Open | Pohlpeter Paula M | $75,650 | |
| Previous Owner | Fanning Joseph W | $67,521 | |
| Closed | Fanning Joseph W | $16,880 |
Source: Public Records
Tax History Compared to Growth
Tax History
| Year | Tax Paid | Tax Assessment Tax Assessment Total Assessment is a certain percentage of the fair market value that is determined by local assessors to be the total taxable value of land and additions on the property. | Land | Improvement |
|---|---|---|---|---|
| 2025 | $1,690 | $101,400 | $20,000 | $81,400 |
| 2024 | $1,526 | $66,600 | $18,000 | $48,600 |
| 2023 | $1,526 | $95,500 | $18,000 | $77,500 |
| 2022 | $1,326 | $81,200 | $17,000 | $64,200 |
| 2021 | $1,416 | $73,000 | $14,000 | $59,000 |
| 2020 | $1,416 | $72,800 | $14,000 | $58,800 |
| 2019 | $1,344 | $71,600 | $14,000 | $57,600 |
| 2018 | $1,304 | $70,900 | $14,000 | $56,900 |
| 2017 | $1,156 | $61,600 | $14,000 | $47,600 |
| 2016 | $1,355 | $63,800 | $14,000 | $49,800 |
| 2015 | $1,170 | $69,157 | $14,000 | $55,157 |
| 2014 | $1,286 | $72,917 | $14,000 | $58,917 |
| 2013 | $1,332 | $72,917 | $14,000 | $58,917 |
Source: Public Records
Map
Nearby Homes
- 1311 I Ave NE
- 1046 12th St NE
- 832 Daniels St NE
- 826 Daniels St NE
- 910 Maplewood Dr NE
- 2011 Sierra Cir NE
- 2000 Sierra Cir NE
- 2015 Sierra Cir NE
- 2006 Sierra Cir NE
- 2019 Sierra Cir NE
- 2012 Sierra Cir NE
- 2023 Sierra Cir NE
- 2018 Sierra Cir NE
- 2103 Sierra Cir NE
- 2109 Sierra Cir NE
- 2102 Sierra Cir NE
- 2115 Sierra Cir NE
- 2110 Sierra Cir NE
- 2116 Sierra Cir NE
- 2121 Sierra Cir NE
- 953 Center Point Rd NE
- 947 Center Point Rd NE
- 941 Center Point Rd NE
- 957 Center Point Rd NE
- 937 Center Point Rd NE
- 948 12th St NE
- 946 12th St NE
- 933 Center Point Rd NE
- 958 12th St NE
- 944 12th St NE
- 1001 Center Point Rd NE
- 1001 Center Point Rd NE
- 956 Center Point Rd NE
- 929 Center Point Rd NE
- 948 Center Point Rd NE
- 950 Center Point Rd NE
- 946 Center Point Rd NE
- 932 12th St NE
- 944 Center Point Rd NE
- 1003 Center Point Rd NE