949 Old Eatherton Rd Glencoe, MO 63038
Estimated Value: $489,000 - $577,000
3
Beds
4
Baths
2,894
Sq Ft
$184/Sq Ft
Est. Value
About This Home
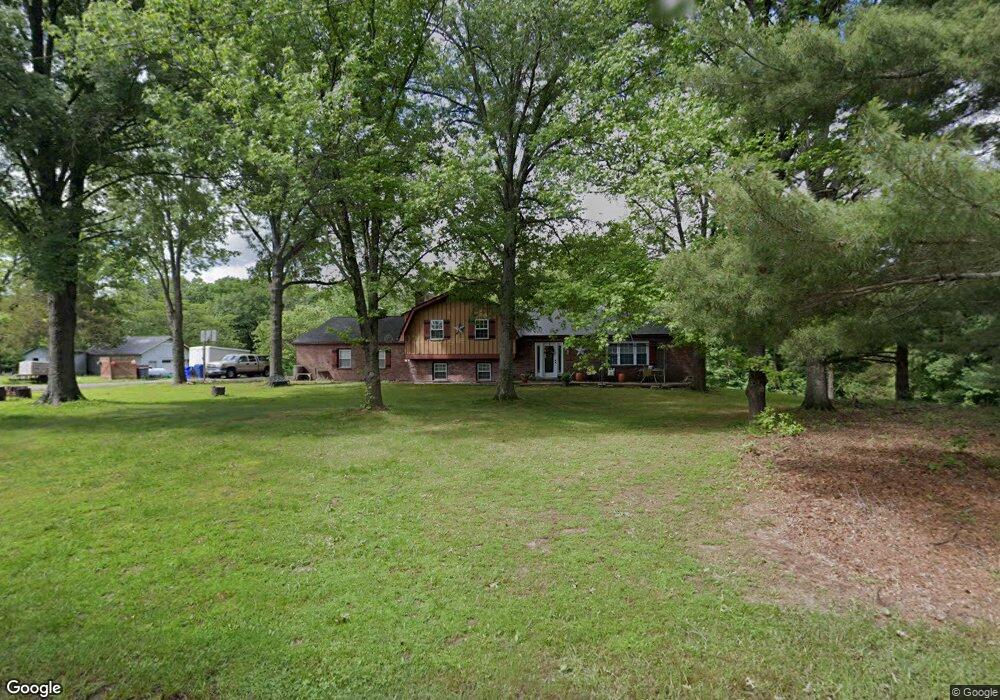
This home is located at 949 Old Eatherton Rd, Glencoe, MO 63038 and is currently estimated at $533,249, approximately $184 per square foot. 949 Old Eatherton Rd is a home located in St. Louis County with nearby schools including Chesterfield Elementary School, Rockwood Valley Middle School, and Lafayette High School.
Ownership History
Date
Name
Owned For
Owner Type
Purchase Details
Closed on
Jan 10, 2014
Sold by
Sapper Roger A and Cordes Susan E
Bought by
Varnadore Randall E and Varnadore Dana M
Current Estimated Value
Home Financials for this Owner
Home Financials are based on the most recent Mortgage that was taken out on this home.
Original Mortgage
$212,759
Outstanding Balance
$161,297
Interest Rate
4.5%
Mortgage Type
FHA
Estimated Equity
$371,952
Purchase Details
Closed on
Sep 30, 2005
Sold by
Macdonald Robert A
Bought by
Cordes Susan E
Home Financials for this Owner
Home Financials are based on the most recent Mortgage that was taken out on this home.
Original Mortgage
$173,600
Interest Rate
5.65%
Mortgage Type
Fannie Mae Freddie Mac
Purchase Details
Closed on
Jun 20, 1997
Sold by
Schmitt Thomas A and Schmitt Denise L
Bought by
Macdonald Robert A
Create a Home Valuation Report for This Property
The Home Valuation Report is an in-depth analysis detailing your home's value as well as a comparison with similar homes in the area
Home Values in the Area
Average Home Value in this Area
Purchase History
| Date | Buyer | Sale Price | Title Company |
|---|---|---|---|
| Varnadore Randall E | $217,500 | Us Title Main | |
| Cordes Susan E | -- | -- | |
| Macdonald Robert A | -- | First American Title Ins Co |
Source: Public Records
Mortgage History
| Date | Status | Borrower | Loan Amount |
|---|---|---|---|
| Open | Varnadore Randall E | $212,759 | |
| Previous Owner | Cordes Susan E | $173,600 |
Source: Public Records
Tax History
| Year | Tax Paid | Tax Assessment Tax Assessment Total Assessment is a certain percentage of the fair market value that is determined by local assessors to be the total taxable value of land and additions on the property. | Land | Improvement |
|---|---|---|---|---|
| 2025 | $5,260 | $83,090 | $24,760 | $58,330 |
| 2024 | $5,260 | $75,170 | $27,230 | $47,940 |
| 2023 | $5,121 | $75,170 | $27,230 | $47,940 |
| 2022 | $4,760 | $64,960 | $27,230 | $37,730 |
| 2021 | $4,733 | $64,960 | $27,230 | $37,730 |
| 2020 | $4,567 | $60,520 | $21,680 | $38,840 |
| 2019 | $4,541 | $60,520 | $21,680 | $38,840 |
| 2018 | $4,794 | $60,270 | $21,680 | $38,590 |
| 2017 | $4,685 | $60,270 | $21,680 | $38,590 |
| 2016 | $4,296 | $53,100 | $16,660 | $36,440 |
Source: Public Records
Map
Nearby Homes
- 1021 Highway 109
- 910 Old Eatherton Rd
- 1302 Wellington View Place
- 17651 Westhampton Woods Dr
- 832 Stone Bridge Springs Dr
- 1002 Chesterfield Forest Dr
- 1032 Chesterfield Forest
- 17824 Valley View Ln
- 1415 Prairie Rose Ln
- 1500 Summit On Pond Ln
- 1605 Ridge Bend Dr
- 1318 Pond Rd
- 9 Wildwood Point Ct
- 1140 Keystone Trail Dr
- 1556 Wildhorse Parkway Dr
- 17716 Birch Leaf Ct
- 1513 Honey Locust Ct
- 310 Wardenburg Farms Dr
- 2470 Indian Tree Cir
- 169 Fick Farm Rd
- 951 Old Eatherton Rd
- 972 Old Eatherton Rd
- 943 Old Eatherton Rd
- 970 Old Eatherton Rd
- 945 Highway 109
- 1366 Paige Estates Ln
- 1366 Paige Estates
- 948 Highway 109
- 1357 Westhampton Woods Ct
- 1353 Westhampton Woods Ct
- 1349 Westhampton Woods Ct
- 17892 Westhampton Woods Dr
- 17957 Rosemar Ln
- 17965 Rosemar Ln
- 17925 Rosemar Ln
- 1356 Westhampton Woods Ct
- 1345 Westhampton Woods Ct
- 17888 Westhampton Woods Dr
- 1352 Westhampton Woods Ct
- 17945 Rosemar Ln
Your Personal Tour Guide
Ask me questions while you tour the home.