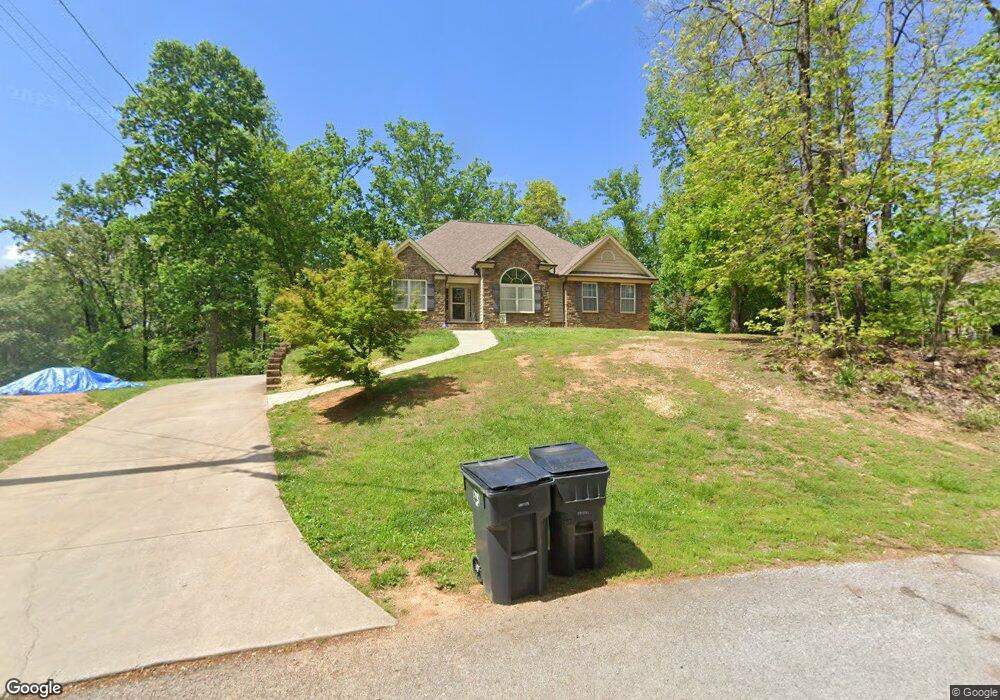
949 Ronald Dr Talbott, TN 37877
Estimated Value: $291,000 - $369,000
Studio
3
Baths
1,662
Sq Ft
$198/Sq Ft
Est. Value
About This Home
This home is located at 949 Ronald Dr, Talbott, TN 37877 and is currently estimated at $329,062, approximately $197 per square foot. 949 Ronald Dr is a home located in Hamblen County with nearby schools including Alpha Elementary School, West View Middle School, and Morristown West High School.
Ownership History
Date
Name
Owned For
Owner Type
Purchase Details
Closed on
May 11, 2012
Sold by
Eisentrout Harry G
Bought by
Akers Russell W and Akers Victoria
Current Estimated Value
Home Financials for this Owner
Home Financials are based on the most recent Mortgage that was taken out on this home.
Original Mortgage
$169,575
Outstanding Balance
$115,866
Interest Rate
3.91%
Mortgage Type
Commercial
Estimated Equity
$213,196
Purchase Details
Closed on
Feb 20, 2009
Sold by
Stone Builders Inc
Bought by
Eisentrout Harry G
Purchase Details
Closed on
Sep 7, 2007
Sold by
Stone Rommie D
Bought by
Stone Builders Inc
Purchase Details
Closed on
Jun 15, 2007
Bought by
Stone Rommie D and Stone Valerie K
Home Financials for this Owner
Home Financials are based on the most recent Mortgage that was taken out on this home.
Original Mortgage
$16,500
Interest Rate
6.16%
Purchase Details
Closed on
Feb 20, 2003
Sold by
Self George A
Bought by
South William H
Purchase Details
Closed on
Mar 1, 2001
Sold by
Hubbs Janet Lee
Bought by
Kilgore Grayland D
Purchase Details
Closed on
Aug 2, 1974
Bought by
Self George Anah
Create a Home Valuation Report for This Property
The Home Valuation Report is an in-depth analysis detailing your home's value as well as a comparison with similar homes in the area
Purchase History
| Date | Buyer | Sale Price | Title Company |
|---|---|---|---|
| Akers Russell W | $178,500 | -- | |
| Eisentrout Harry G | $180,000 | -- | |
| Stone Builders Inc | $23,917 | -- | |
| Stone Rommie D | $20,600 | -- | |
| South William H | $15,000 | -- | |
| Kilgore Grayland D | $91,900 | -- | |
| Self George Anah | $2,600 | -- |
Source: Public Records
Mortgage History
| Date | Status | Borrower | Loan Amount |
|---|---|---|---|
| Open | Akers Russell W | $169,575 | |
| Previous Owner | Self George Anah | $16,500 |
Source: Public Records
Tax History
| Year | Tax Paid | Tax Assessment Tax Assessment Total Assessment is a certain percentage of the fair market value that is determined by local assessors to be the total taxable value of land and additions on the property. | Land | Improvement |
|---|---|---|---|---|
| 2025 | $1,175 | $79,925 | $8,875 | $71,050 |
| 2024 | $938 | $47,600 | $5,525 | $42,075 |
| 2023 | $938 | $47,600 | $0 | $0 |
| 2022 | $938 | $47,600 | $5,525 | $42,075 |
| 2021 | $938 | $47,600 | $5,525 | $42,075 |
| 2020 | $938 | $47,600 | $5,525 | $42,075 |
| 2019 | $942 | $44,225 | $5,475 | $38,750 |
| 2018 | $942 | $44,225 | $5,475 | $38,750 |
| 2017 | $942 | $44,225 | $5,475 | $38,750 |
| 2016 | $880 | $44,225 | $5,475 | $38,750 |
| 2015 | $818 | $44,225 | $5,475 | $38,750 |
| 2014 | -- | $44,225 | $5,475 | $38,750 |
| 2013 | -- | $43,450 | $0 | $0 |
Source: Public Records
Map
Nearby Homes
- 1050 Briar Ct
- 595 Ricky Dr
- 930 Shaver Dr
- 725 Ellencliff Cir
- 7220 Briarwood Dr
- 230 Greenbriar Rd
- 1437 Beacon Rd
- 7300 W Andrew Johnson Hwy
- 7350 W Andrew Johnson Hwy
- 2559 Dogwood Ln
- 1167 Cherry Blossom Ln
- 6 Talbott-Kansas Rd
- 7 Talbott-Kansas Rd
- 566 Shaver Dr
- 6987& 6989 W Andrew Johnson Hwy
- 7033 S Crest Ave
- 1256 Pratt Rd
- 1253 Cole Dr
- 1245 Cole Dr
- 1237 Cole Dr
- 945 Ronald Dr
- 7549 Kathryn Cir
- 955 Ronald Dr
- 925 Ronald Dr
- 7517 Primrose Cir
- 940 Ronald Dr
- 7519 Primrose Cir
- 930 Ronald Dr
- 945 Whippoorwill Dr
- 975 Ronald Dr
- 935 Whippoorwill Dr
- 910 Ronald Dr
- 7516 Primrose Cir
- 7535 Kathryn Cir
- 895 Ronald Dr
- 7546 Kathryn Cir
- 890 Ronald Dr
- 7511 Primrose Cir
- 970 Ronald Dr
- 905 Whippoorwill Dr
Your Personal Tour Guide
Ask me questions while you tour the home.