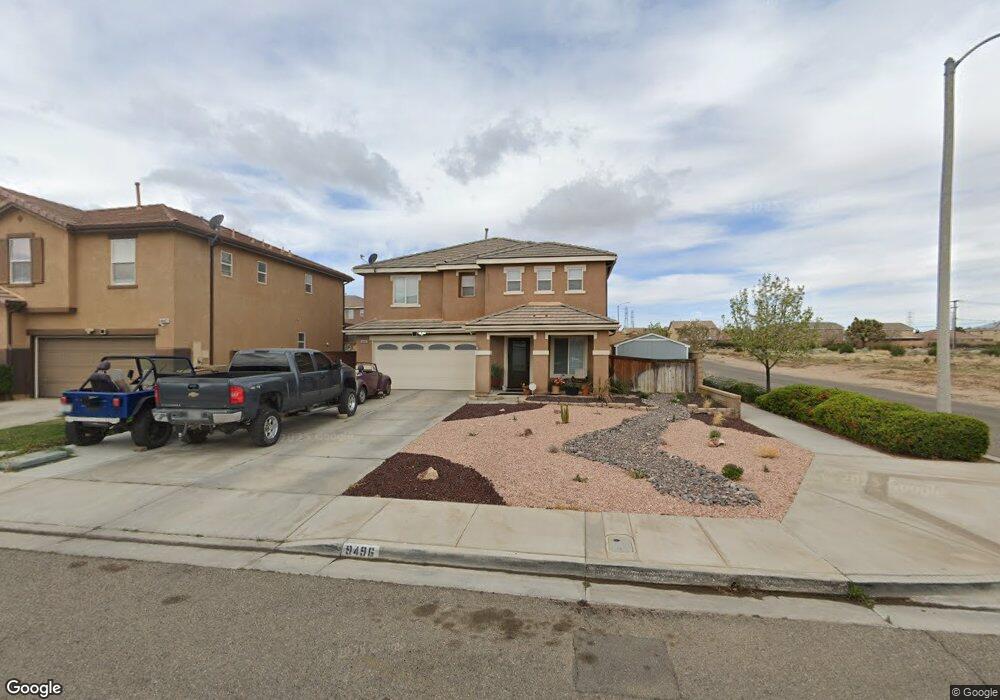
9496 Apricot Ct Hesperia, CA 92345
High Country NeighborhoodEstimated Value: $473,252 - $614,000
4
Beds
3
Baths
2,602
Sq Ft
$204/Sq Ft
Est. Value
About This Home
This home is located at 9496 Apricot Ct, Hesperia, CA 92345 and is currently estimated at $529,813, approximately $203 per square foot. 9496 Apricot Ct is a home located in San Bernardino County with nearby schools including Cottonwood Elementary School, Hesperia Junior High School, and Hesperia High School.
Ownership History
Date
Name
Owned For
Owner Type
Purchase Details
Closed on
Dec 12, 2008
Sold by
The Bank Of New York
Bought by
Larios Javier
Current Estimated Value
Home Financials for this Owner
Home Financials are based on the most recent Mortgage that was taken out on this home.
Original Mortgage
$162,850
Outstanding Balance
$104,182
Interest Rate
5.49%
Mortgage Type
FHA
Estimated Equity
$425,631
Purchase Details
Closed on
Sep 3, 2008
Sold by
Pacleb Amante P and Pacleb Editha A
Bought by
The Bank Of New York and Cwabs Inc Asset Backed Certificates Seri
Purchase Details
Closed on
Nov 18, 2005
Sold by
Kb Home Greater Los Angeles Inc
Bought by
Pacleb Amante P and Pacleb Editha A
Home Financials for this Owner
Home Financials are based on the most recent Mortgage that was taken out on this home.
Original Mortgage
$299,753
Interest Rate
6.9%
Mortgage Type
New Conventional
Create a Home Valuation Report for This Property
The Home Valuation Report is an in-depth analysis detailing your home's value as well as a comparison with similar homes in the area
Home Values in the Area
Average Home Value in this Area
Purchase History
| Date | Buyer | Sale Price | Title Company |
|---|---|---|---|
| Larios Javier | $165,000 | Chicago Title Company | |
| The Bank Of New York | $158,400 | Accommodation | |
| Pacleb Amante P | $375,000 | Fidelity-Riverside |
Source: Public Records
Mortgage History
| Date | Status | Borrower | Loan Amount |
|---|---|---|---|
| Open | Larios Javier | $162,850 | |
| Previous Owner | Pacleb Amante P | $299,753 |
Source: Public Records
Tax History Compared to Growth
Tax History
| Year | Tax Paid | Tax Assessment Tax Assessment Total Assessment is a certain percentage of the fair market value that is determined by local assessors to be the total taxable value of land and additions on the property. | Land | Improvement |
|---|---|---|---|---|
| 2025 | $2,672 | $212,483 | $38,634 | $173,849 |
| 2024 | $2,672 | $208,316 | $37,876 | $170,440 |
| 2023 | $2,670 | $204,231 | $37,133 | $167,098 |
| 2022 | $2,661 | $200,227 | $36,405 | $163,822 |
| 2021 | $2,607 | $196,301 | $35,691 | $160,610 |
| 2020 | $2,573 | $194,288 | $35,325 | $158,963 |
| 2019 | $2,527 | $190,478 | $34,632 | $155,846 |
| 2018 | $2,433 | $186,743 | $33,953 | $152,790 |
| 2017 | $2,351 | $183,081 | $33,287 | $149,794 |
| 2016 | $2,273 | $179,491 | $32,634 | $146,857 |
| 2015 | $2,203 | $176,795 | $32,144 | $144,651 |
| 2014 | $2,133 | $173,331 | $31,514 | $141,817 |
Source: Public Records
Map
Nearby Homes
- 9454 Apricot Ct
- 0 Olive St
- 14064 Gold St
- 14075 Tourmaline St
- 0 Orange St Unit CV25243744
- 0 Orange St Unit CV25173962
- 0 Orange St Unit AR25167276
- 0 Orange St Unit AR25167241
- 0 Orange St Unit HD25032994
- 0 Orange St Unit PW24212323
- 0 Orange St Unit HD24031273
- 14073 Ruby St
- 14236 Main St
- 14131 Desert Rose St
- 0 Tamarisk Ave Unit HD23052637
- 9143 Ocotillo Ave
- 14572 Sultana St
- 13868 Rosemary St
- 14602 Main St
- 8888888 Smoketree St