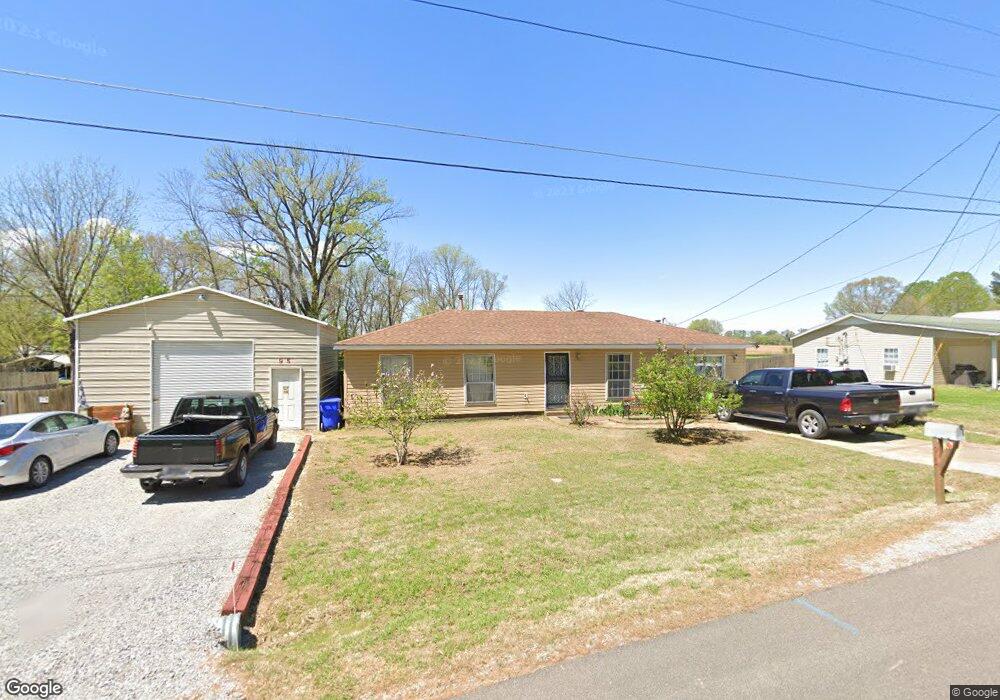
95 Cole Rd Drummonds, TN 38023
Estimated Value: $183,432 - $235,000
Studio
1
Bath
1,280
Sq Ft
$162/Sq Ft
Est. Value
About This Home
This home is located at 95 Cole Rd, Drummonds, TN 38023 and is currently estimated at $207,108, approximately $161 per square foot. 95 Cole Rd is a home located in Tipton County with nearby schools including Drummonds Elementary School, Munford Middle School, and Munford High School.
Ownership History
Date
Name
Owned For
Owner Type
Purchase Details
Closed on
Sep 24, 2004
Sold by
Beaudoin Christina A
Bought by
Sullins David L
Current Estimated Value
Home Financials for this Owner
Home Financials are based on the most recent Mortgage that was taken out on this home.
Original Mortgage
$74,700
Outstanding Balance
$36,239
Interest Rate
5.78%
Estimated Equity
$170,869
Purchase Details
Closed on
May 30, 2000
Sold by
Weber Shirley A
Bought by
Christina Beaudoin
Purchase Details
Closed on
Oct 5, 1994
Purchase Details
Closed on
May 9, 1994
Bought by
Chemical Bank Trustee For American Housi
Purchase Details
Closed on
Aug 12, 1993
Bought by
Murphy Charles N
Purchase Details
Closed on
Jul 25, 1988
Bought by
Murphy Charles N and Murphy Frances A
Purchase Details
Closed on
Jun 23, 1988
Purchase Details
Closed on
Apr 21, 1988
Purchase Details
Closed on
Sep 29, 1983
Bought by
Kehayias Matthew John and Kehayias Elizabeth
Create a Home Valuation Report for This Property
The Home Valuation Report is an in-depth analysis detailing your home's value as well as a comparison with similar homes in the area
Purchase History
| Date | Buyer | Sale Price | Title Company |
|---|---|---|---|
| Sullins David L | -- | -- | |
| Christina Beaudoin | $74,900 | -- | |
| -- | -- | -- | |
| Weber Shirley A | $28,000 | -- | |
| Chemical Bank Trustee For American Housi | -- | -- | |
| Murphy Charles N | -- | -- | |
| Murphy Charles N | $39,000 | -- | |
| -- | -- | -- | |
| -- | -- | -- | |
| Kehayias Matthew John | -- | -- |
Source: Public Records
Mortgage History
| Date | Status | Borrower | Loan Amount |
|---|---|---|---|
| Open | Kehayias Matthew John | $74,700 |
Source: Public Records
Tax History
| Year | Tax Paid | Tax Assessment Tax Assessment Total Assessment is a certain percentage of the fair market value that is determined by local assessors to be the total taxable value of land and additions on the property. | Land | Improvement |
|---|---|---|---|---|
| 2025 | $566 | $37,225 | $5,725 | $31,500 |
| 2024 | $566 | $37,225 | $5,725 | $31,500 |
| 2023 | $566 | $37,225 | $5,725 | $31,500 |
| 2022 | $546 | $26,750 | $4,200 | $22,550 |
| 2021 | $546 | $26,750 | $4,200 | $22,550 |
| 2020 | $451 | $22,100 | $4,200 | $17,900 |
| 2019 | $378 | $15,600 | $3,925 | $11,675 |
| 2018 | $378 | $15,600 | $3,925 | $11,675 |
| 2017 | $378 | $15,600 | $3,925 | $11,675 |
| 2016 | $378 | $15,600 | $3,925 | $11,675 |
| 2015 | $377 | $15,600 | $3,925 | $11,675 |
| 2014 | $377 | $15,592 | $0 | $0 |
Source: Public Records
Map
Nearby Homes
- 138 Gayden Dr
- 410 Brown Rd
- 0 McClarin Dr
- 471 Milton Rd
- 218 Cedar Point Rd
- 1368 Mathis Rd
- 1426 Simmons Rd
- 0 Dixon Rd
- 121 Reed Cir
- 3270 Rast Rd
- 0 Reed Cir Unit 10192357
- 0 W Union Rd Unit 10210462
- 37 N Wyatt Shankle Cove
- 0 Susan's Cir Unit 10212417
- 544 Rachel Shankle Dr
- 0 Barnett Bluff Rd
- 5545 Shipp Rd
- 5553 Shipp Rd
- 5557 Shipp Rd
- 5548 Rams Horn Cove
Your Personal Tour Guide
Ask me questions while you tour the home.